7.1. Troubleshoot a slow service using the Service Latency workflow
When services are running slowly, it can be challenging to determine whether the problem lies with the service itself or the network it's running on. cClear's Network Observability workflows allow you to drill down as you see problems, using all of the relevant metrics in real-time. For example, when a customer reports a slow service, you can use the Service Latency workflow dashboards to quickly identify and troubleshoot the problem. These dashboards allow you to analyze service metrics and drill down into the data to find solutions so you can better understand the issue and take appropriate actions.
In this scenario, you investigate a slow service and use the Service Latency workflow dashboards to answer critical questions about service performance.
What is the average response time for the service, and does it change over time?
Is there a particular time of day when the service is slow?
Are there any specific endpoints that are performing poorly?
Is network latency or packet loss a potential issue?
7.1.1. View the service metrics
Your customer support team receives a complaint at 5 PM that the ACME service is running slowly and impacting the team's work. You need to quickly identify the root cause of the issue and resolve it to ensure customers can continue to use this critical service without interruption.
Go to the Observability page in the cClear UI and click Overview
 in the Services row. The dashboard opens in a new tab.
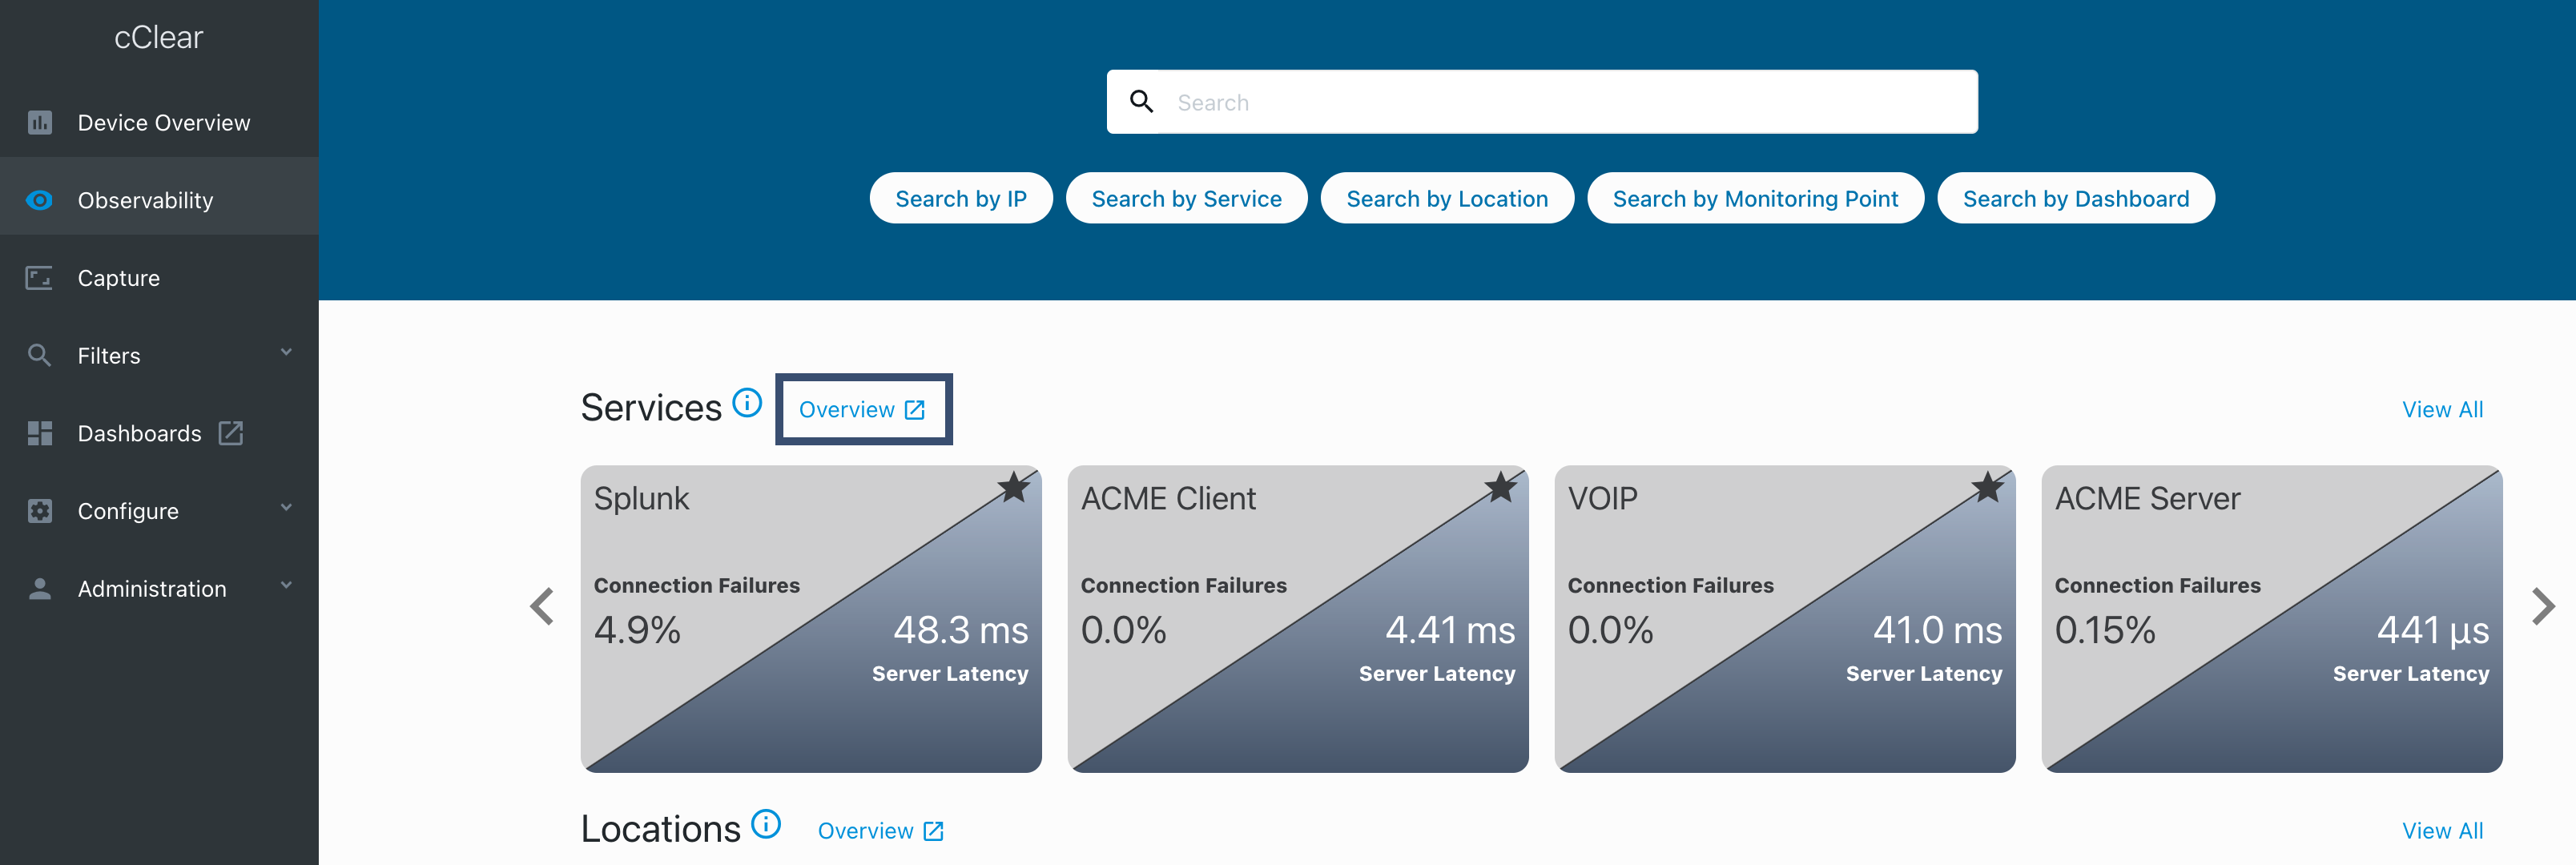
The Services Overview dashboard displays metrics for latency and connection errors for all services that have been active for the last 24 hours.
Figure 4. Services Overview dashboard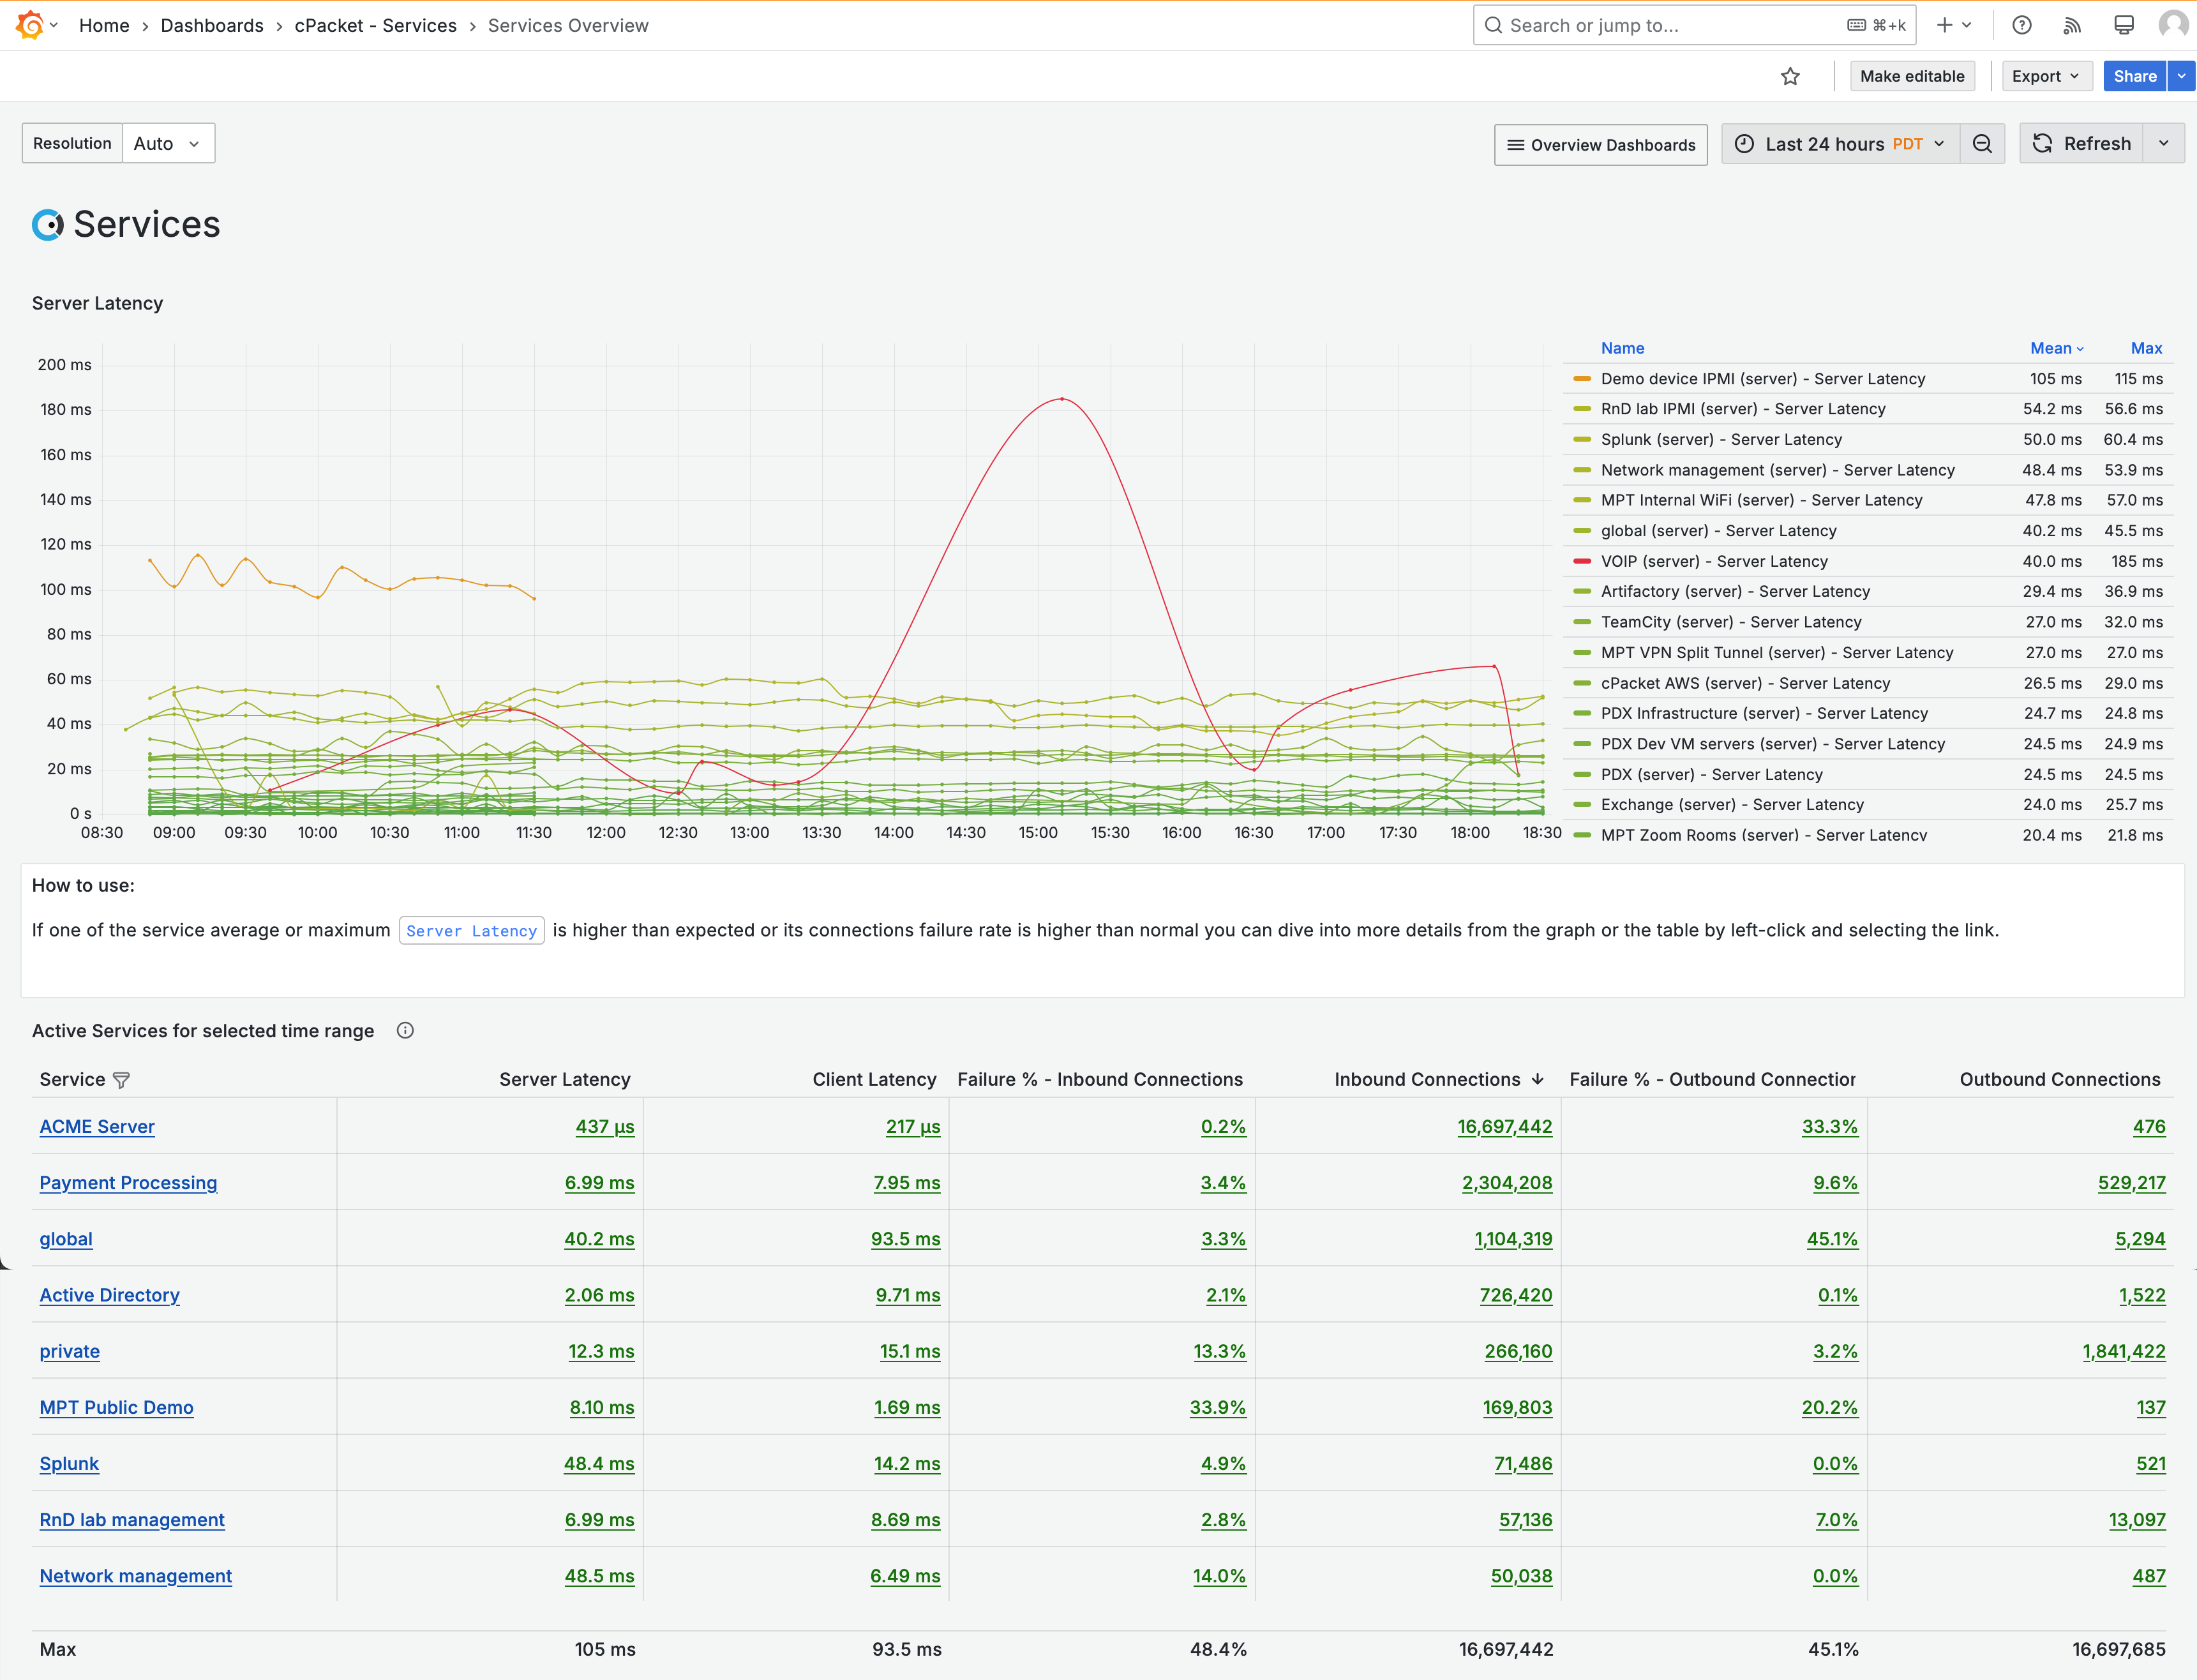
You need to get to the ACME metrics, and you can do so by filtering the Service column. Click Filter
 for the Service column, select ACME Server , and then click OK.
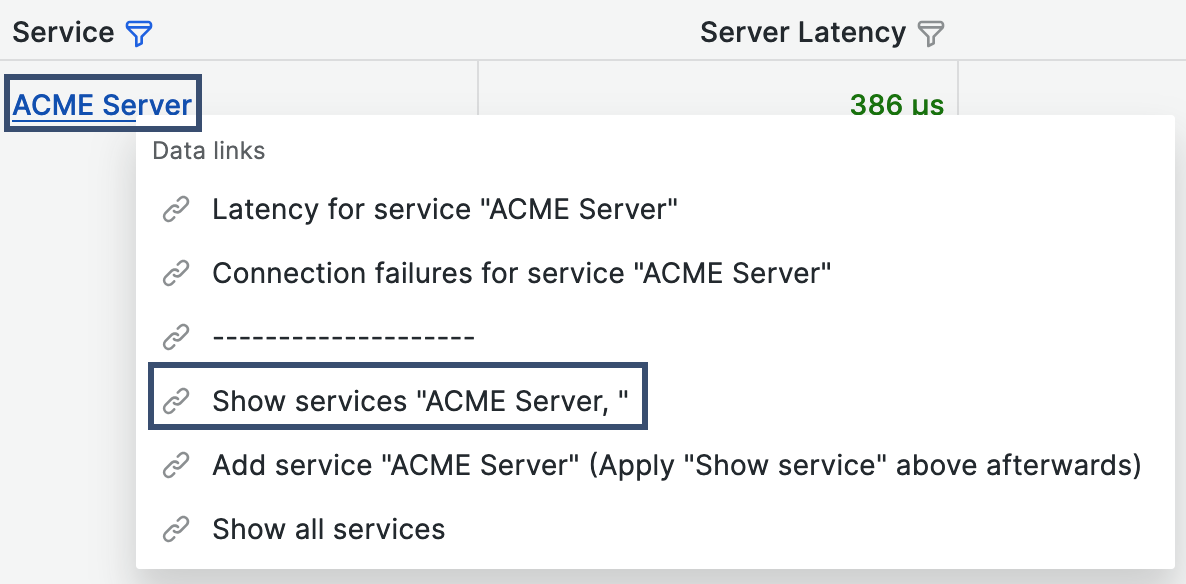
To display only the ACME Server metrics on the graph, click the ACME Server tag in the table and select the data link Show services "ACME Server".
You notice an increase in latency between 4 PM and 5 PM, right before you received the complaint. Use the graph to zoom in and view the metric activity for that time range. This creates a custom time range that is applied across all dashboards in the workflow.
7.1.2. Where is the latency occurring?
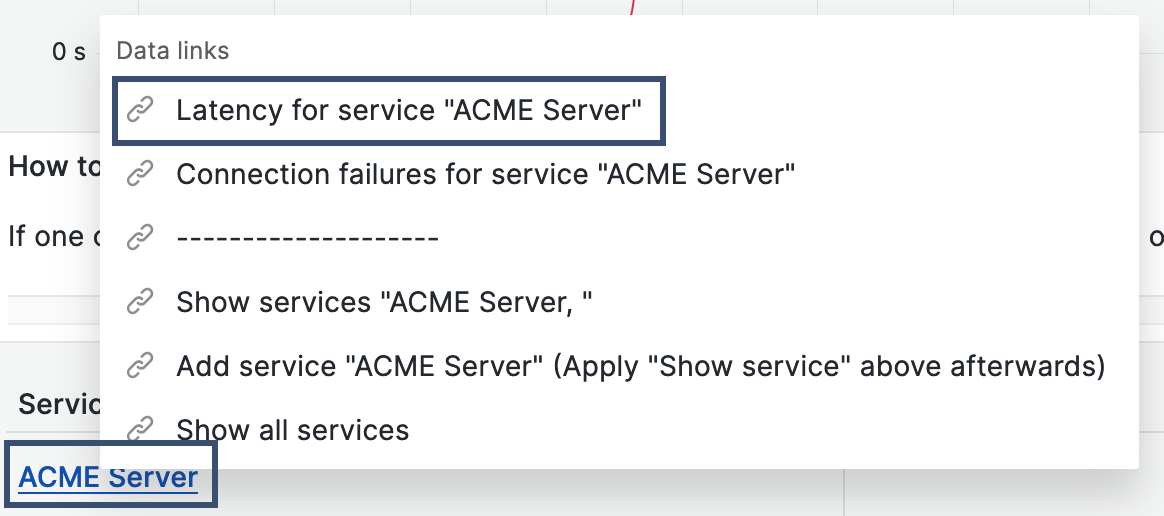
You drill down to determine if the latency for the ACME Server occurs at specific points in the network or if it is present across all monitoring points. Click the tag ACME Server and select the Latency for service "ACME Server" data link.
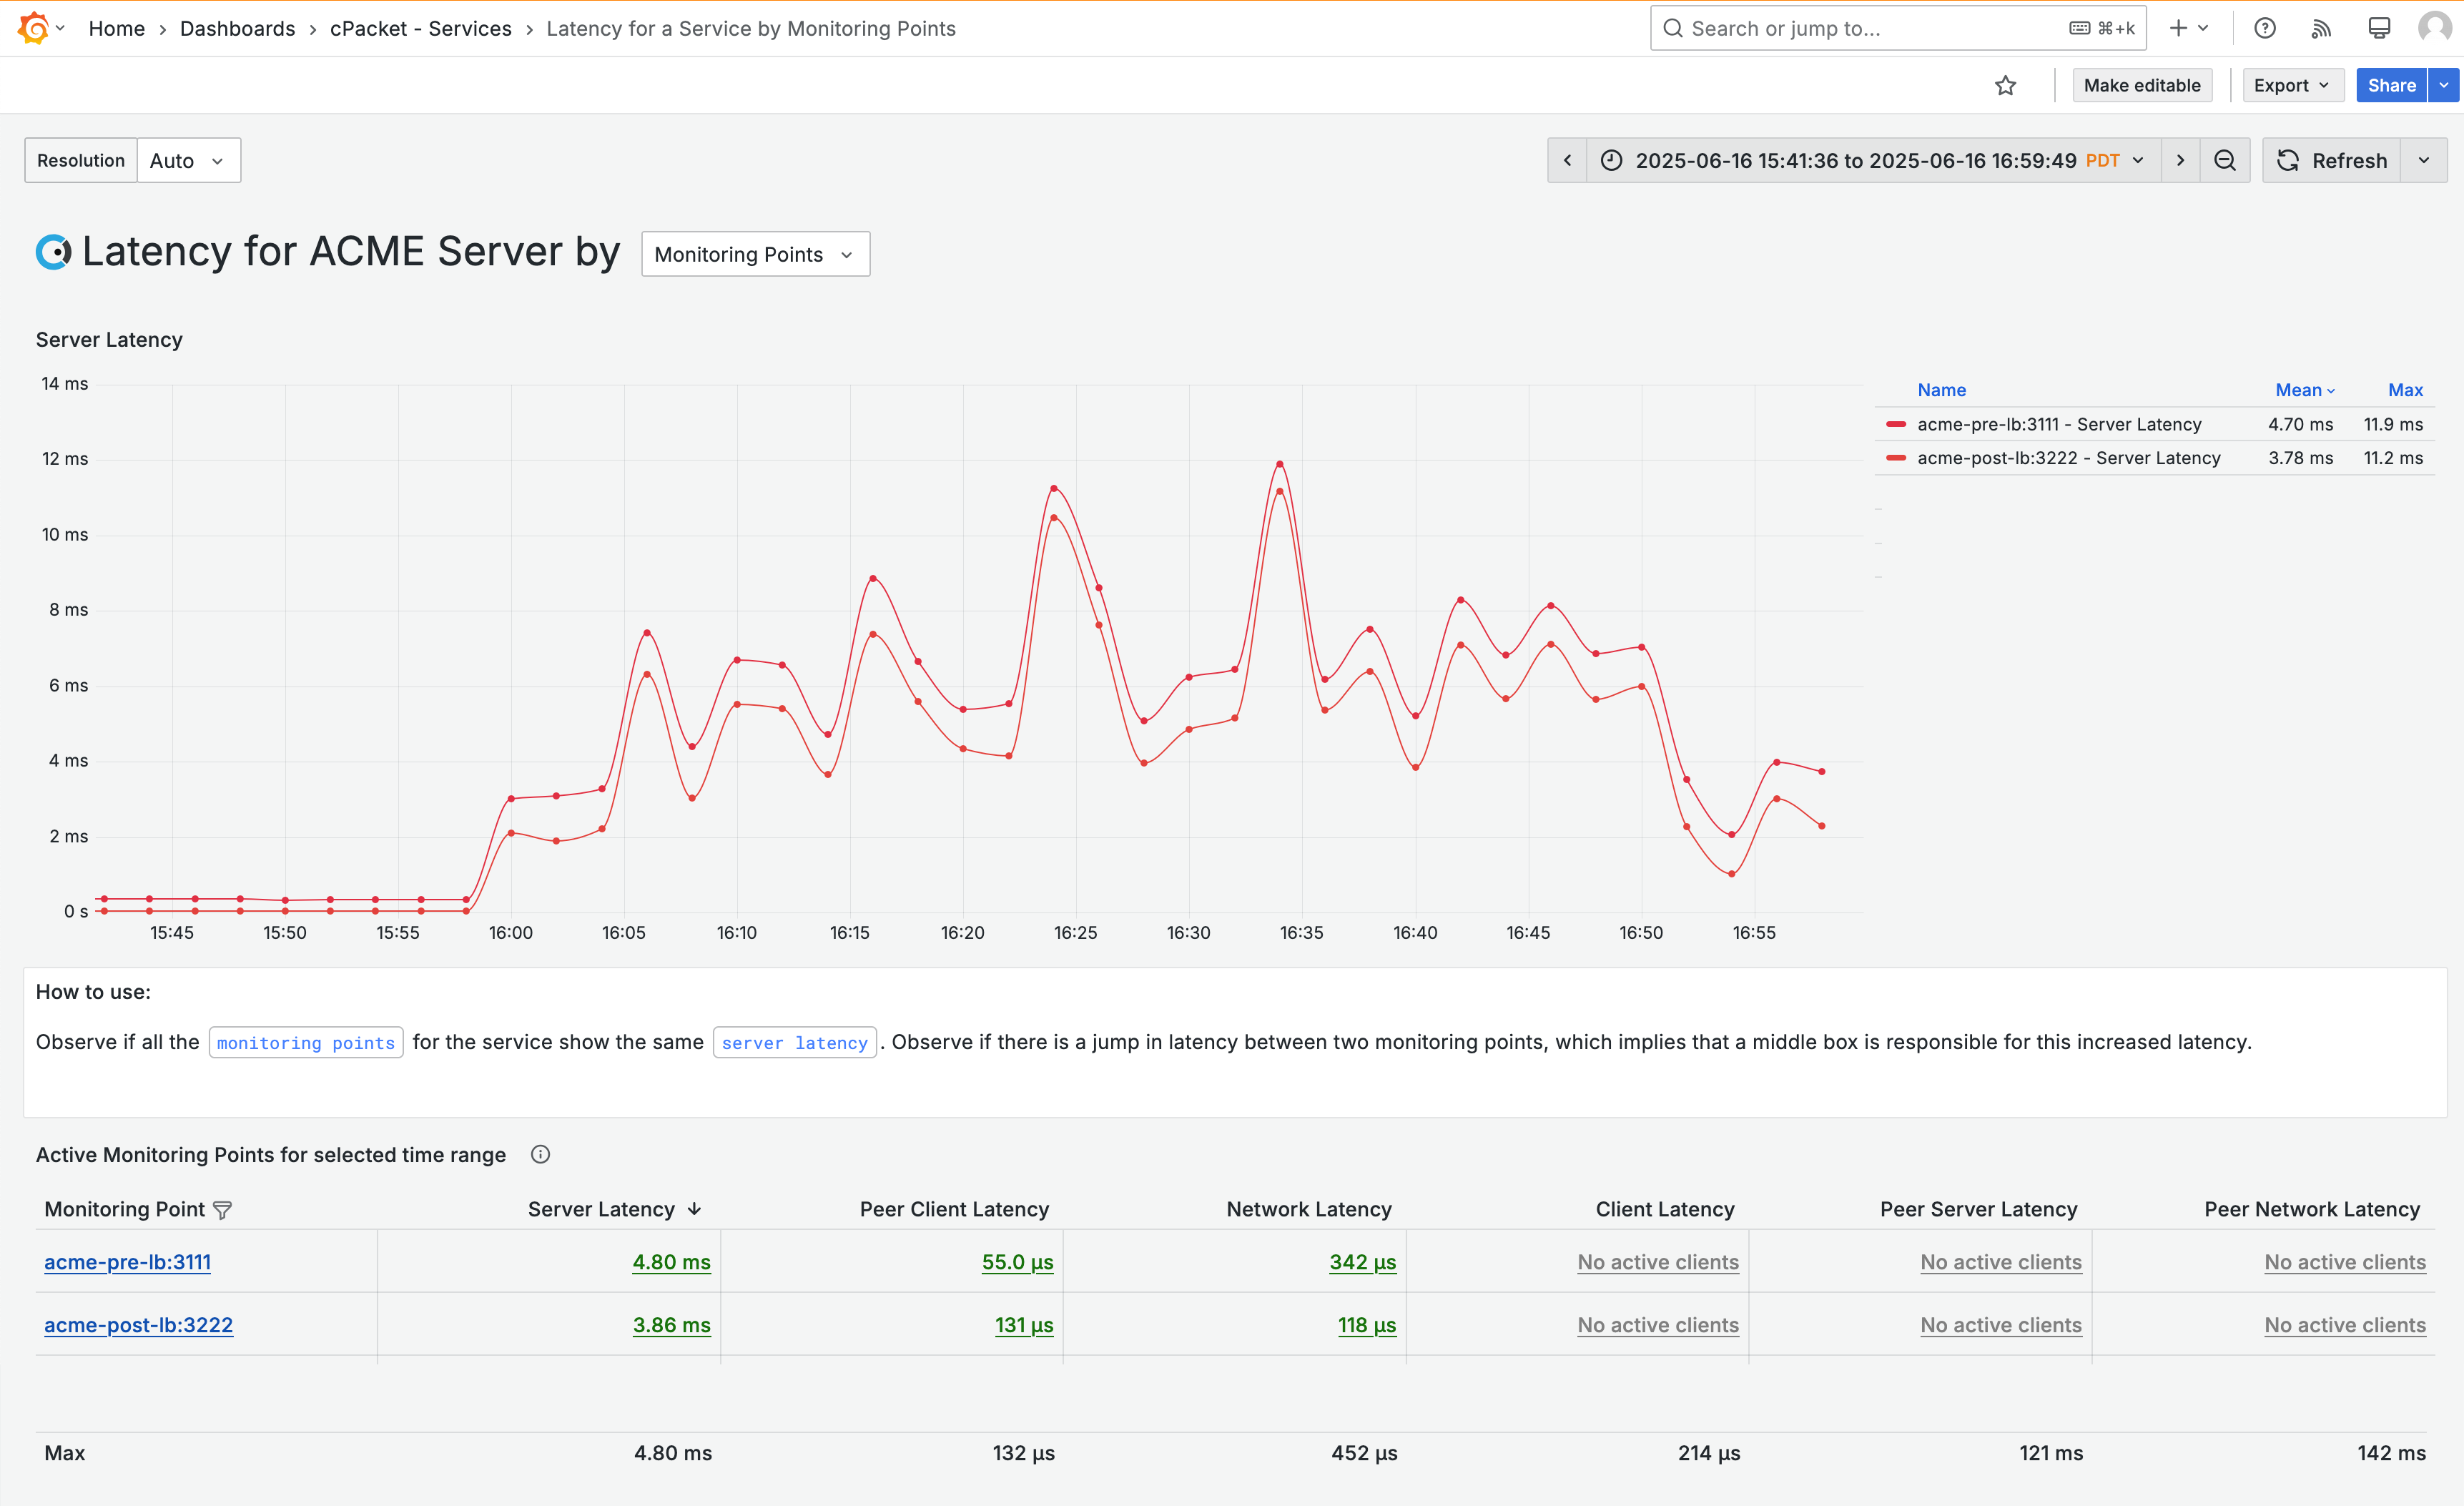
The ACME Server has two monitoring points: the ACME pre-load balancer and the ACME post-load balancer. You notice that the latency for both monitoring points is impacted and follows the same pattern. This suggests that the problem with the service is not on the network path but on the server itself.
7.1.3. What is causing the latency?
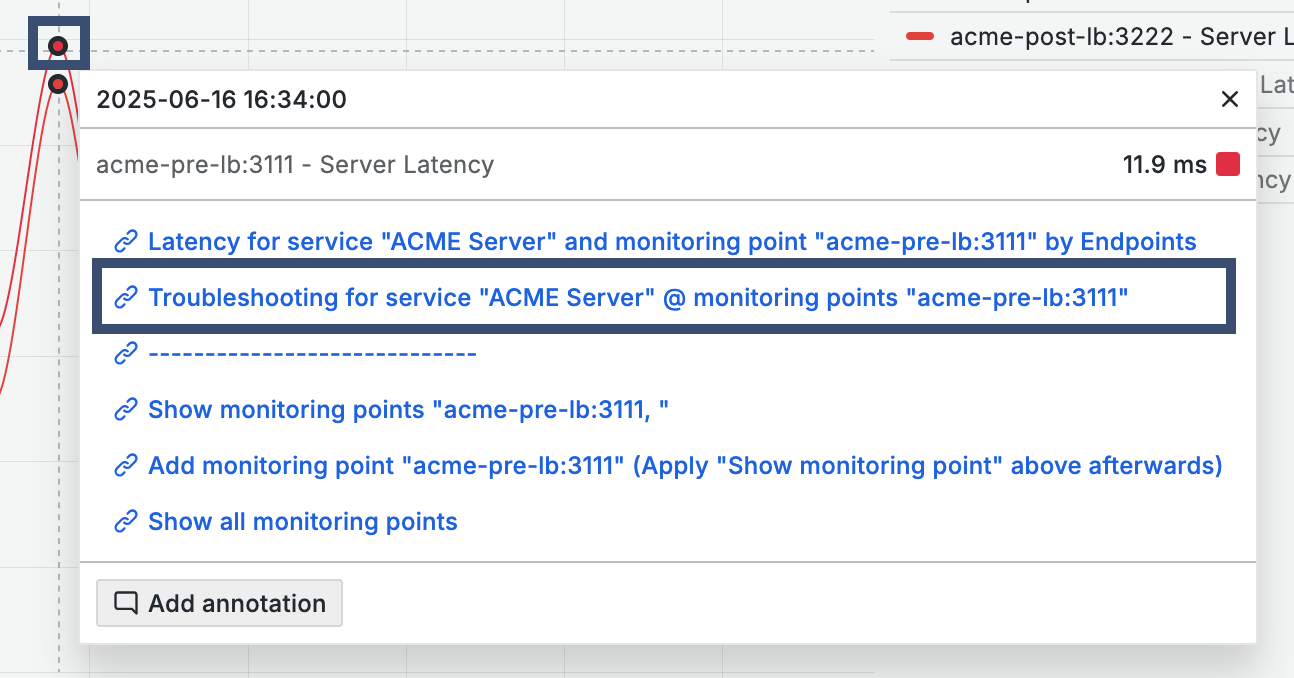
To confirm your suspicion that the latency is caused by the server, you drill down to the troubleshooting dashboard, where you can access additional metrics. Click on any data point in the graph for acme-pre-lb:3111 and select the data link Troubleshooting for service "ACME Server" @ monitoring point "acme-pre-lb:3111".
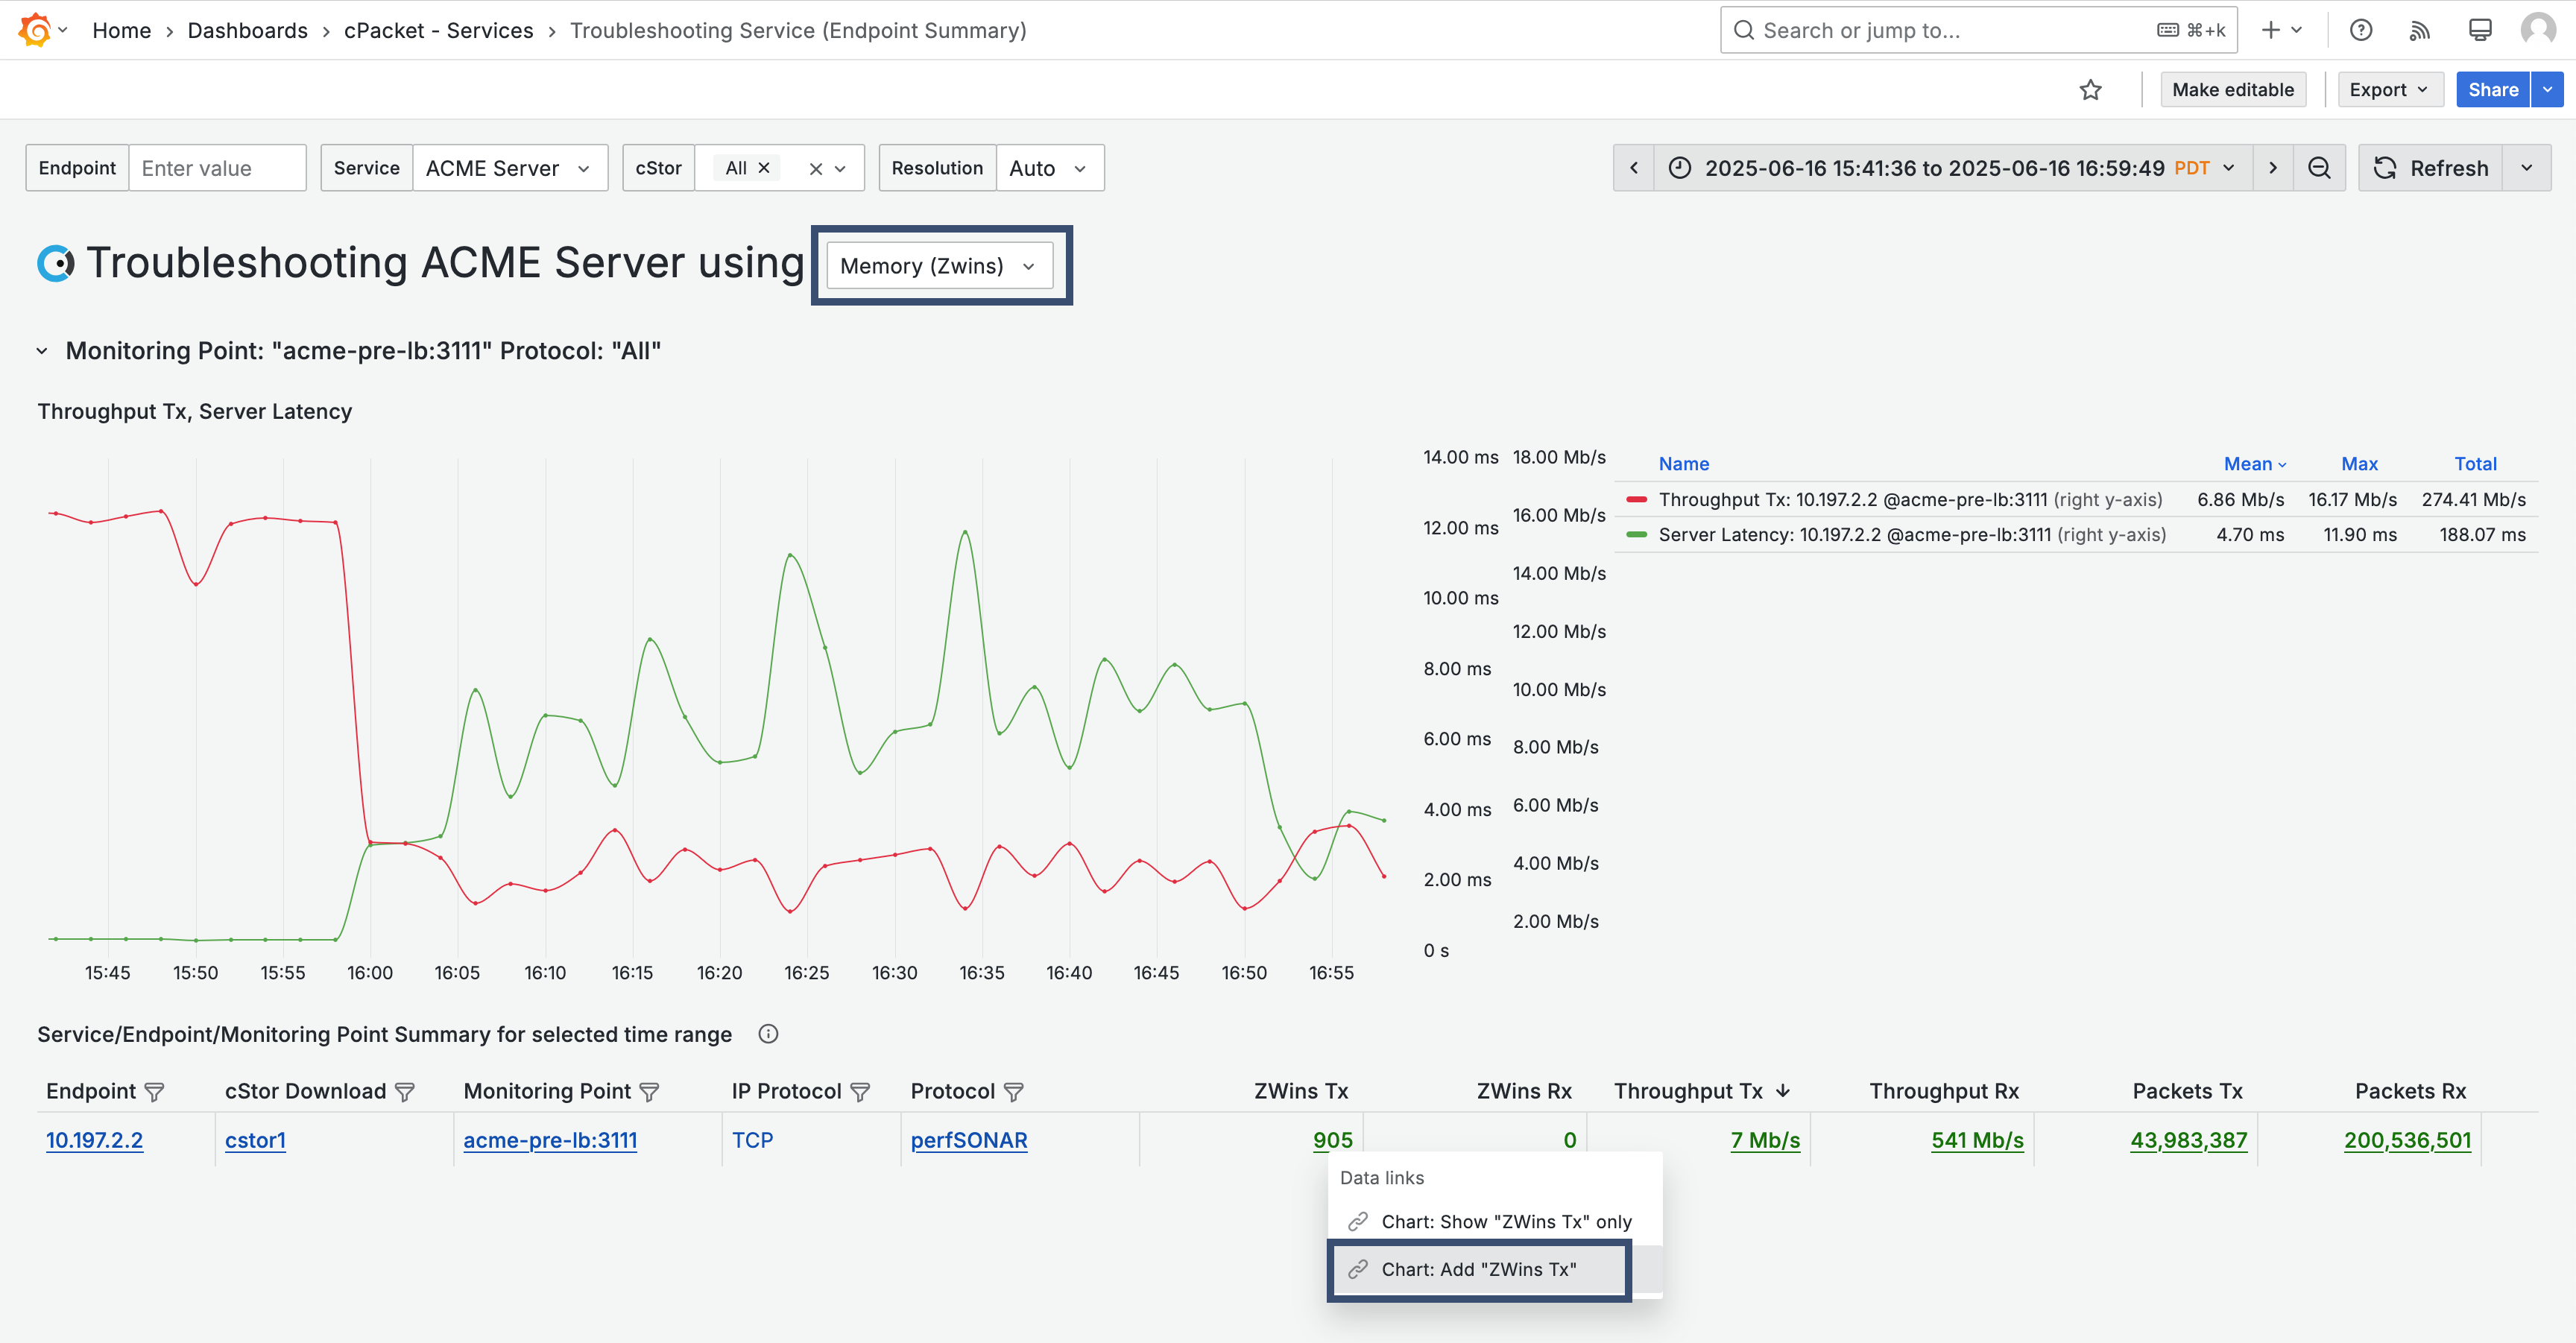
The default metric for the Level 3 troubleshooting dashboard is Throughput Tx. You observe the throughput for the ACME server drops at 4 PM, and you want to compare it to the server latency metric. To incorporate server latency into the graph, click on the metric for Server Latency and select the data link Chart: Add "Server Latency". You may need to scroll to the right in the table to view the server latency metric.
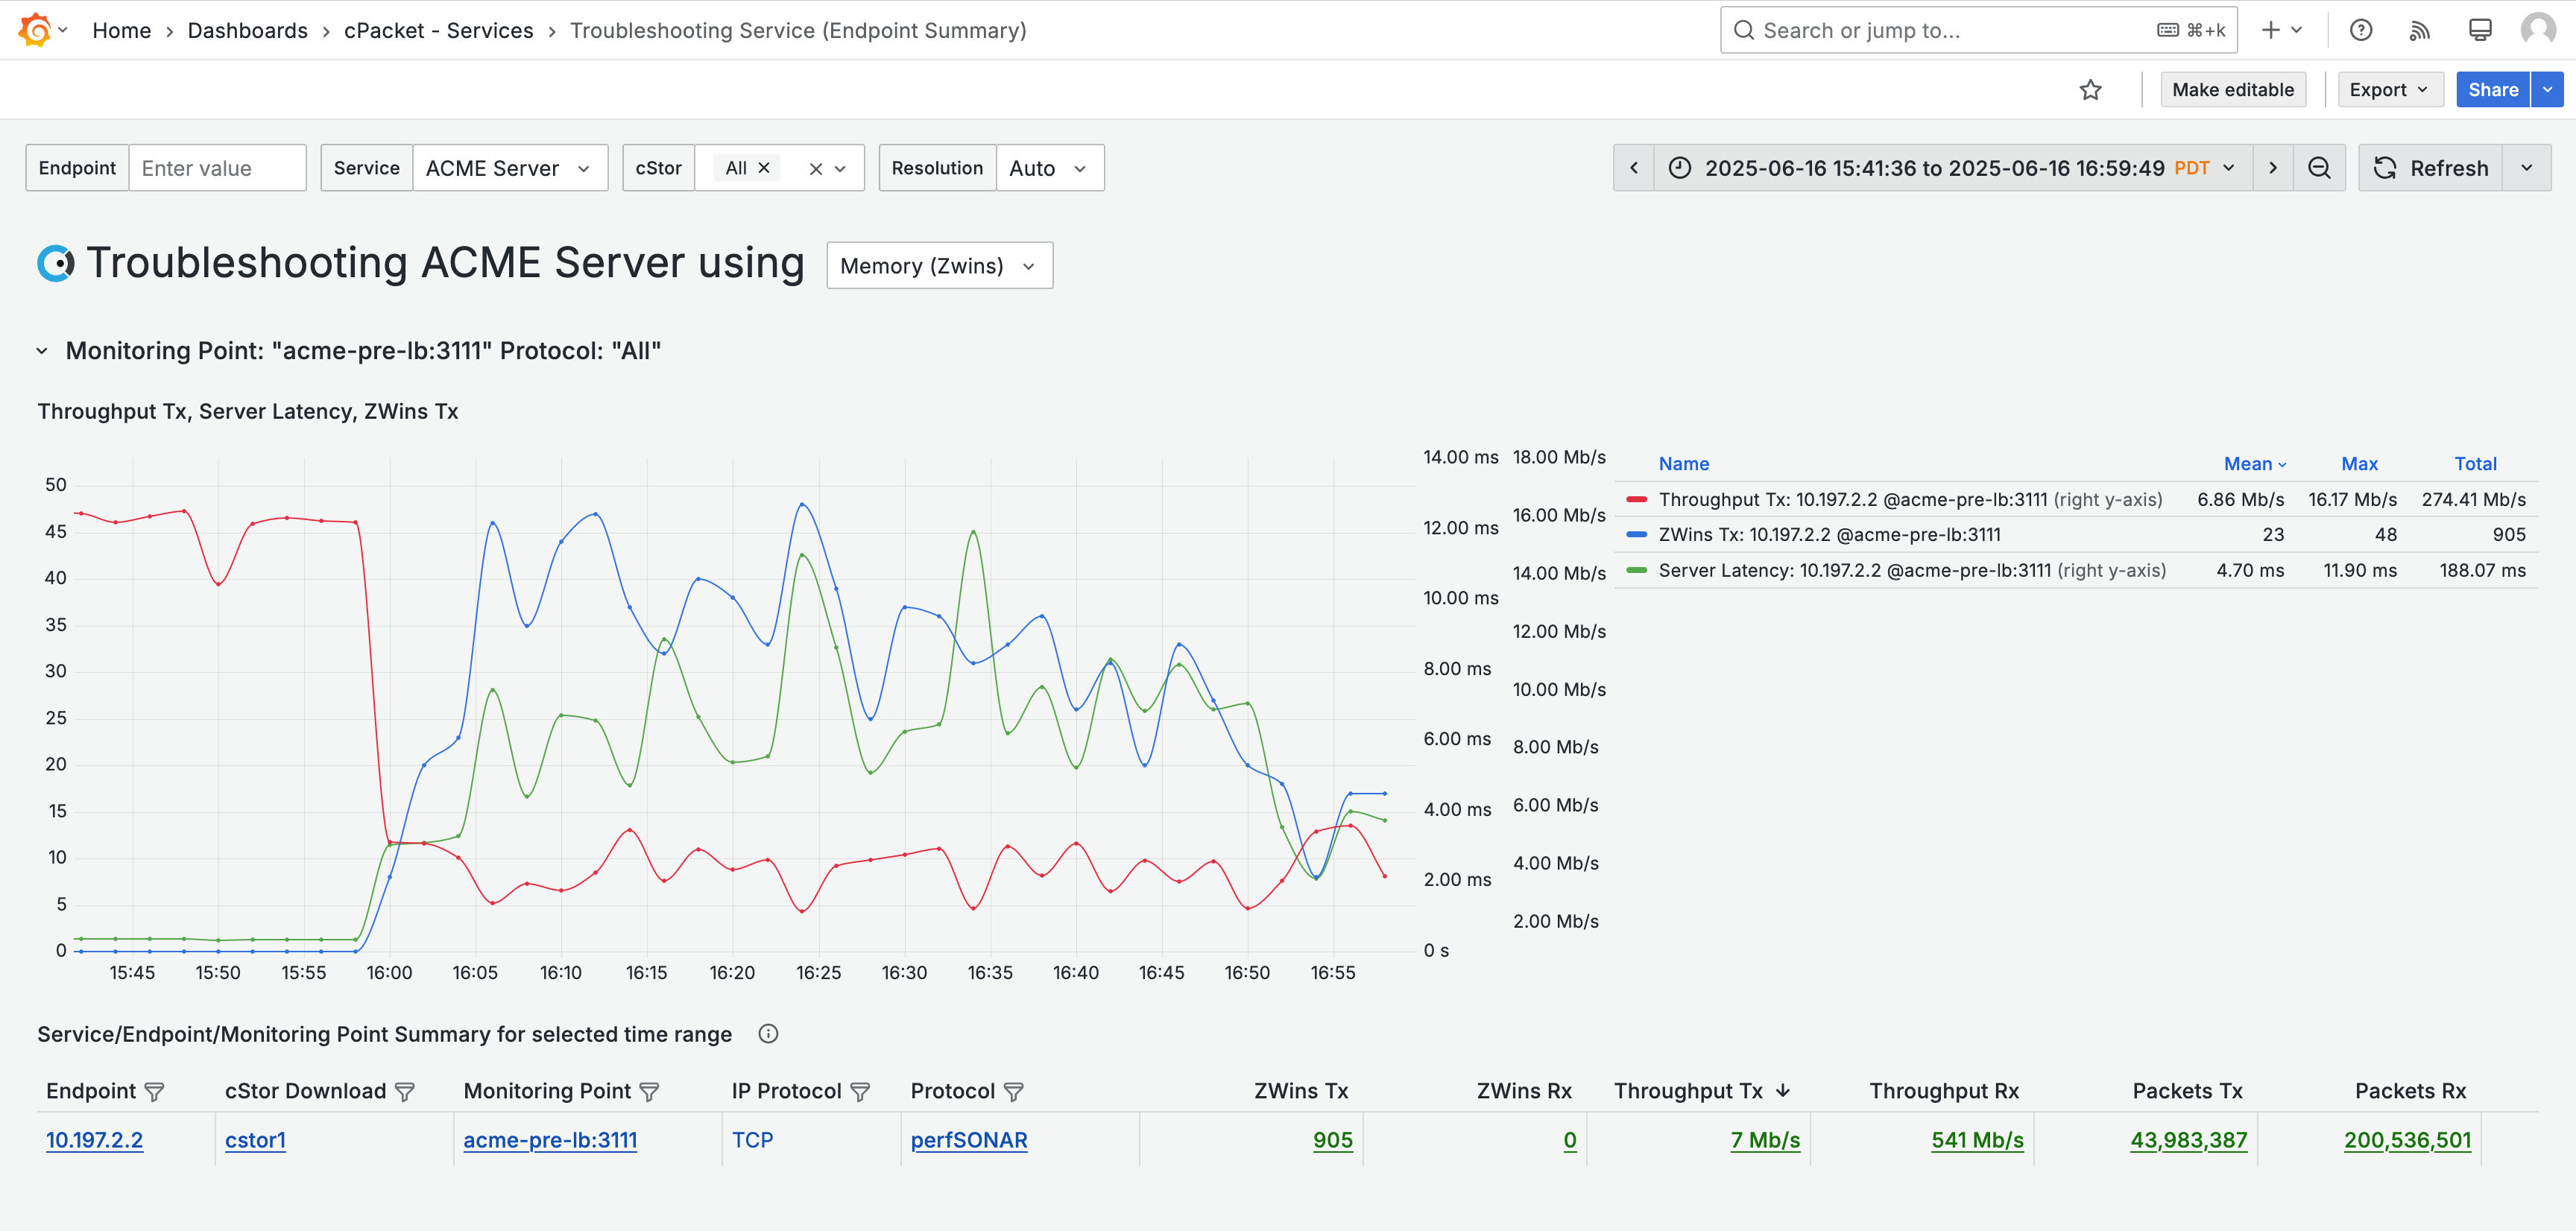
You notice the server throughput dropped when latency increased. Next, you check to see if the server is overloaded based on memory. Use the selector in the dashboard title and choose Memory (Zwins). Then, use the metric data link Chart: Add "ZWins Tx" to add ZWins Tx to the graph.
You find high ZWins between 4 PM and 5 PM, indicating a memory issue. This suggests that the service is struggling to keep up with the demands of the users, and it's contributing to the latency.
Given the high memory usage, it's also important to consider the impact of the increased server load on communication with the server. This leads you to check for retransmissions. Retransmissions occur when the server doesn't receive an acknowledgment for the data packets it has sent, forcing it to resend the packets. Use the selector in the dashboard title to choose Retransmissions . Then, add Retransmissions Rx to the graph using the metric data link "Chart: Add "Retrans Rx".
A large number of retransmissions are also observed between 4 PM and 5 PM, indicating server congestion.
7.1.4. Conclusion
Based on the data, you conclude that the ACME Server is overloaded due to high memory usage and retransmissions, which impact throughput and cause latency. By using cClear's Observability dashboards and drilling down into the data, you have successfully pinpointed the underlying cause of the issue. This enables you to create a plan to address the problem and offer a clear explanation to the customer.