6.2.3. Interact with the legend
Filter using the legend
The legend accompanying each panel’s graph can be used to filter what is shown in the graph by removing series data from the visualization.
Click on the label of a series you want to isolate. The plots for all other series will be removed from view, and the vertical axis will be rescaled. Click on the same label again to restore the graph to its initial state.
To incrementally isolate or add series data back to an isolated series, use the Ctrl or Command key and select the label of the series you want to add. To revert back to the default view that includes all data, click any series label twice.
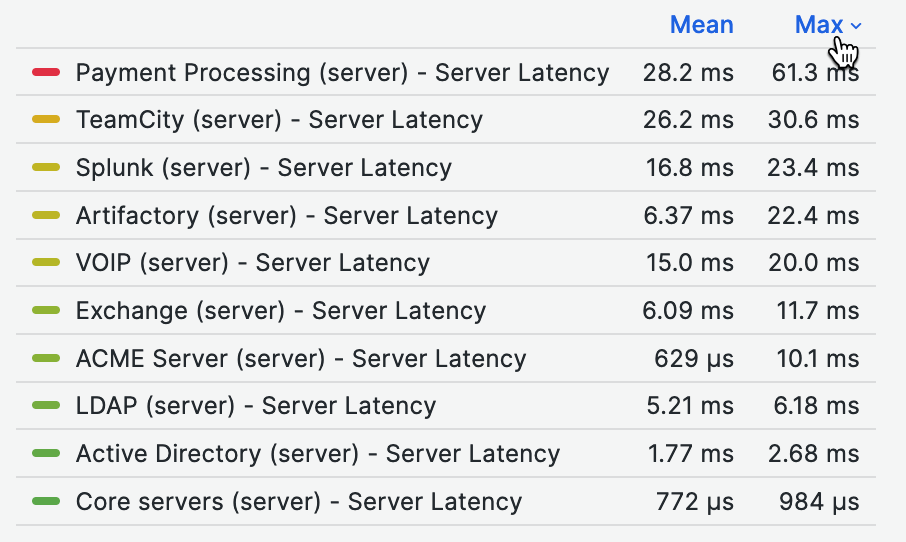
Sort by value in the legend
Click a column header to change the sort order from default to ascending to descending. Each time you click, the sort order changes to the next option in the cycle.
 |
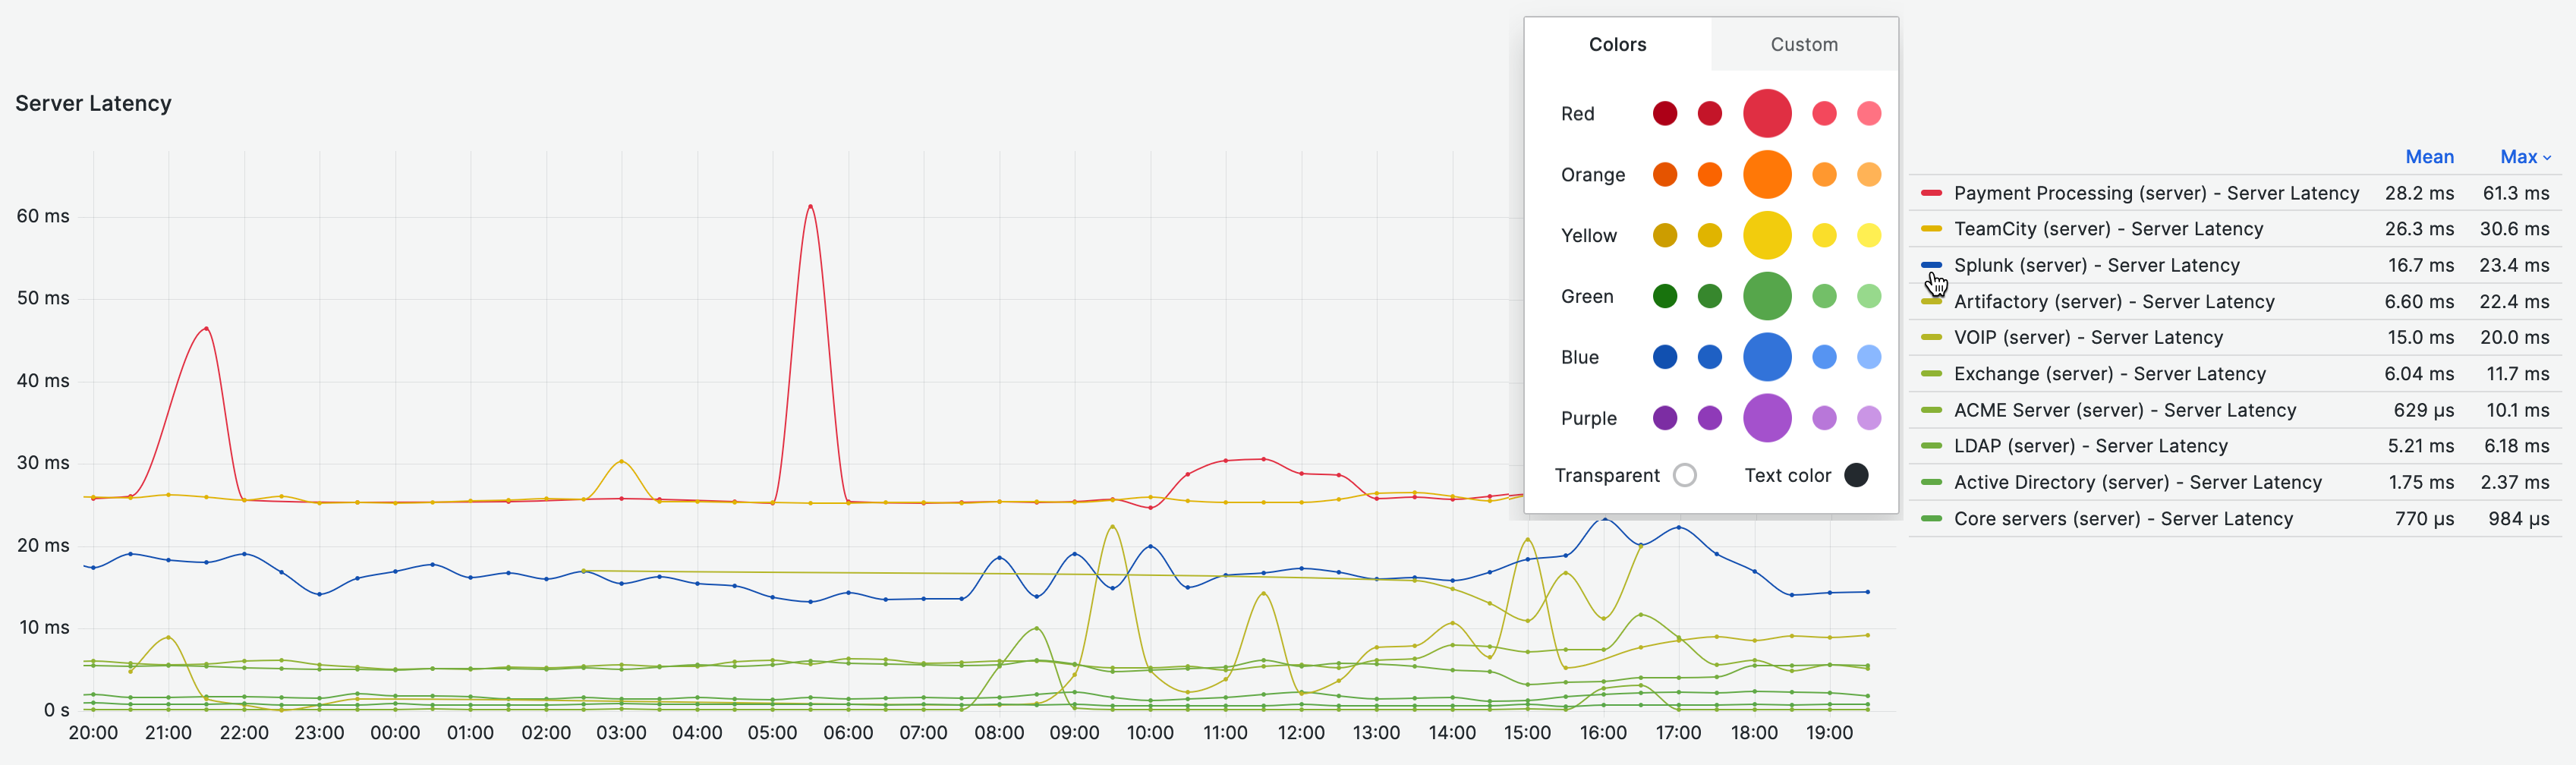
Change a series color
The dashboard's default color palette of green, yellow, and red is automatically assigned based on the percentage of a value relative to the min and the max of the field or series. You can change it through the legend to easily distinguish one or more series in a complex graph.
In the legend, click the color bar associated with the series.
Select a pre-set color in the Colors tab or set a custom color in the Custom tab using the picker or RGB values.