2.2.3. Network monitors
Network monitors map application sessions to networking components, such as IPs, VLANs, and VXLANs, enabling better application mapping to the network. This allows you to simplify your workflows to focus on services instead of having to fully understand the network structure, connectivity, routing policies, etc.
Collected data from the network monitors is available for visualization on Grafana dashboards.
The following network monitors are supported:
- Network Health
Network Health collects analytics for TCP sessions and flows. It provides bi-directional metrics for TCP sessions and single-direction analytics from source to destination. This monitor is designed to collect aggregated 4-Tuple TCP metrics and flows for sessions and flows within a configured subnet CIDR from a configured cStor device.
The TCP 4-tuple includes the server IP, server port, client IP, and client port. TCP data consists of per-conversation and active session metrics, including:
Per-side counters for high-level TCP information such as packets, bytes, and fragments.
Maximum packet size.
Per-side signaling for connection setup, tear-down, and completed sessions based on SYN, SYNACK, RST, and FIN.
Per-side latency metrics such as RTT and response time.
Per-side TCP metrics for performance and errors, such as window scale size, minimum window size, zero windows, sequence errors, retransmissions, duplicates, and gaps.
The flow 4-tuple includes the source IP, destination IP, IP protocol, and known application port. Flow data consists of per-flow metrics, including:
Counters for the number of packets, bytes, and IP fragments seen in a flow.
Maximum packet size in a flow.
- DHCP Analytics
The DHCP Analytics monitor collects metrics for message types, transaction IDs, client metadata (IP address, hardware address), server and gateway IP addresses, SMTP, and agent information within a configured subnet CIDR from a configured cStor device.
- DNS Analytics
The DNS Analytics monitor collects metrics for requests, query types, query domains, the requester and responder IP addresses, and transaction response times within a configured subnet CIDR from a configured cStor device.
- HTTPS Analytics
HTTPS Analytics monitor allows for the collection of HTTPS protocol analytics within a configured subnet CIDR from a configured cStor device.
This HTTPS data includes the handshake version, cipher suite, client hello, server hello, handshakes accepted, handshake response time, fatal alerts, SNI, and TLS certificates.
TLS Certificates data includes the serial number, issuer, subject, version, validity, and session count.
- ICMP Analytics
The ICMP Analytics monitor collects metrics for transactions, response times, type and code counts with descriptions, and original packet metadata (source and destination IPs, ports, and packet IDs) within a configured subnet CIDR from a configured cStor device.
- LDAP Analytics
The LDAP Analytics monitor collects LDAP protocol analytics within a configured subnet CIDR from a configured cStor device. It captures both setup and per-operation metrics. Setup metrics include response times, security mechanisms such as bind and startTLS, user identifiers, and any errors encountered. Per-operation metrics cover transactions, response times, and error codes, organized by operation types including search, modify, add, delete, modify DN, compare, and extensions.
- Market Data Analytics
cClear's Market Data Analytics monitors allow for the collection of 7-Tuple Market Data analytics for configured cMDF multicast groups within a configured subnet CIDR from a configured cStor device.
This cMDF data consists of per-feed metrics, including:
The feed's market data protocol.
Counters for the number of packets, bytes, messages, heartbeats, and resets seen in that feed.
cMDF sequence errors, gaps, reorders, and duplicates.
cMDF latency metrics such as transit time and max packet delay variation (PDV).
- Multicast Analytics
cClear's Multicast Analytics monitors allow for the collection of IGMP and PIM analytics within a configured subnet CIDR from a configured cStor device. This multicast data consists of per-group metadata, including:
Group membership by client IP.
Multicast sources and routers.
Known multicast applications.
PIM message activity.
IGMP membership query, report, and leave message activity.
- Video Analytics
cClear's Video Analytics monitor allows for the collection of video analytics for configured RTP flows within a configured subnet CIDR from a configured cStor device.
This Video Analytics data consists of per-session health metrics, including:
Counters for the number of packets, bytes, and IP fragments seen in that flow.
RTP sequence errors and lost packets.
RTP latency metrics such as jitter and skew.
- VPN Analytics
cClear's VPN Analytics monitors allow for the collection of VPN analytics for ESP flows within a configured subnet CIDR from a configured cStor device.
This VPN data consists of per-session (identified via ESP SPI) health metrics, including:
Counters for the number of packets, bytes, and IP fragments seen in that flow.
ESP sequence errors and lost packets.
Create and enable network monitors
Go to Configure > Network Monitors and click Add New.
Enter a meaningful monitor name and description (optional). Select the monitor type and CIDR using the IP/Prefix format. To collect all data from all source and destination IP addresses (and set the CIDR to 0.0.0.0/0), select the Collect all data check box.
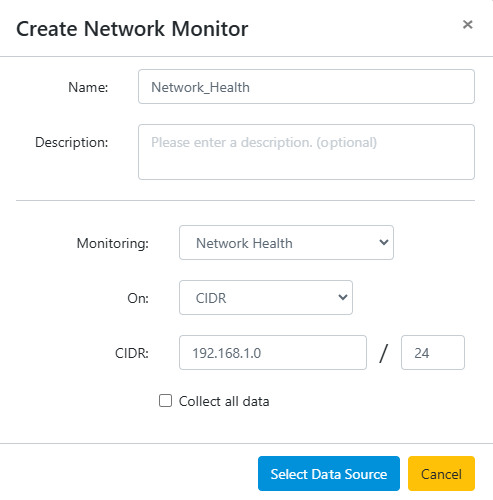
Click Select Data Source to continue.
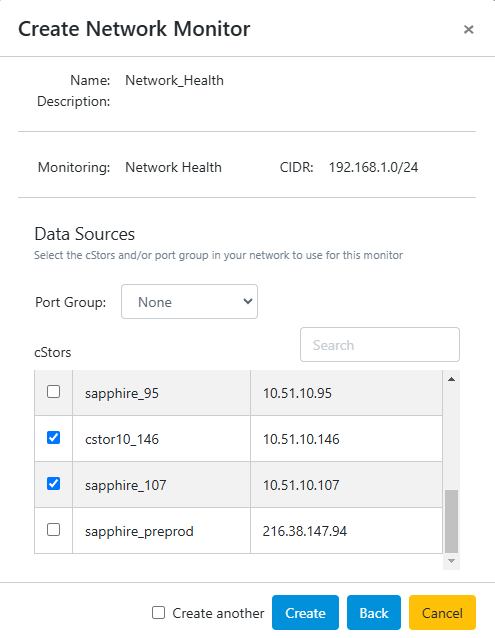
Select the cStor or Port Group to use for the monitor. Click Create to save the network monitor. To quickly add additional network monitors, select Create another before clicking Create.
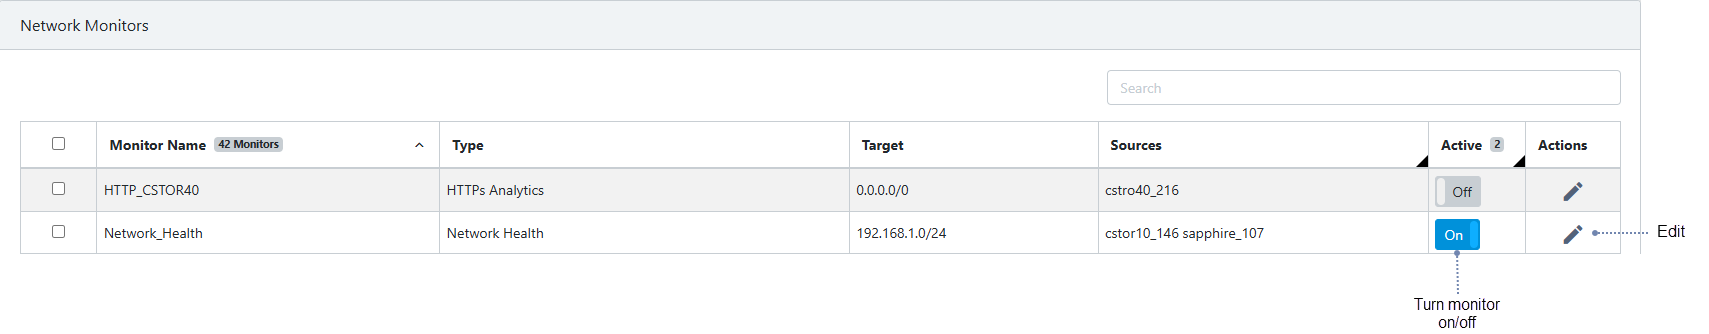
After saving, an overview of network monitors is displayed. From here, the monitors can be enabled, disabled, modified, or removed. Activating a network monitor is required for analytics to be collected. To enable a network monitor, turn on the Active toggle.