5.1. Laterally traverse to related dashboards
Use the selector in the dashboard title of the Level 1, and some Level 2 dashboards to access related dasbhoards that apply to the same context. These dashboards are at the same hierarchical level and allow you to move laterally across the workflow, providing a more comprehensive view of your network's performance.
In the following example, the Monitoring Points by Services dashboard, categorized as a Level 1 dashboard within the Explore Monitoring Points workflow, focuses on the monitoring point acme- pre-lb and includes the services ACME Client and ACME Server, visible in the table's tag column.
Using the selector in the dashboard title, you can switch perspectives on the same data set to view the monitoring point acme-pre-lb by endpoints or protocols. Selecting these options will navigate you to the Level 1 dashboards titled Monitoring Points by Endpoints and Monitoring Points by Protocols.
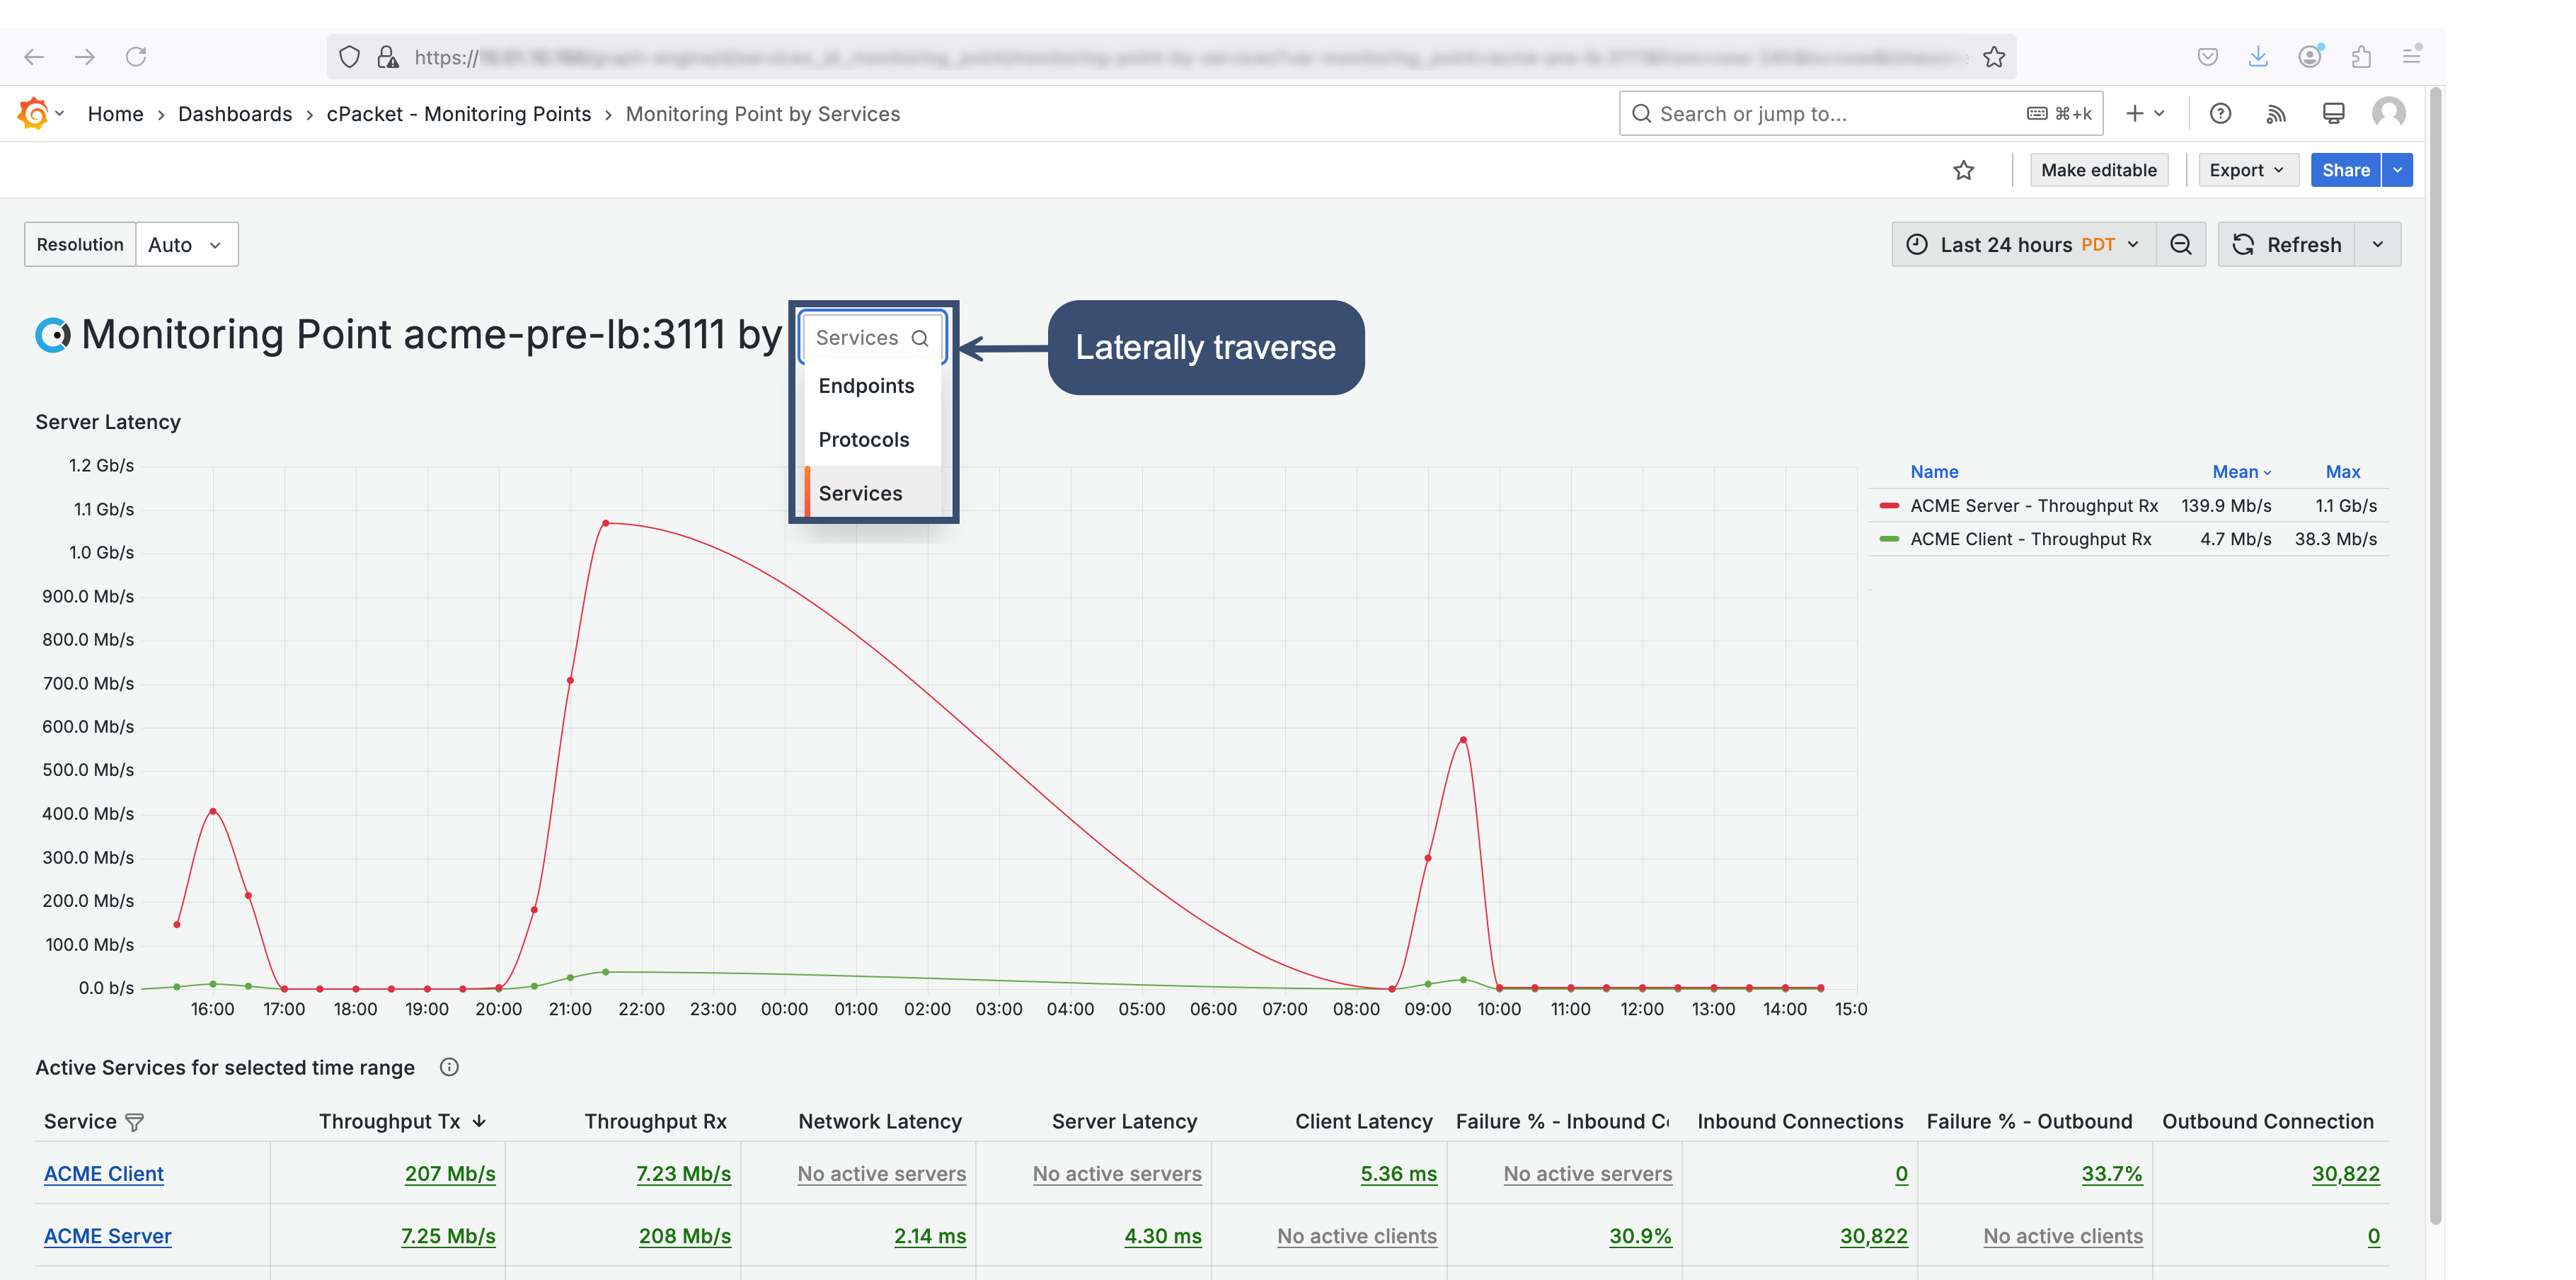
Use the selector in the dashboard title to navigate to other dashboards at the same level in the workflow.