2.2.4. Utilize analytics labels for network observability
Analytics labels allow you to logically organize endpoints, define monitoring points, and identify protocols within your network for the purpose of understanding your unique network. This not only streamlines the troubleshooting process but also accelerates identifying and resolving potential issues.
The use of analytics labels is a key component of the network observability workflow dashboards. They serve as tags within the dashboards to categorize and filter data. You can also find analytics labels on the Observability home page, marking the starting point for the network observability workflows.
Create labels using the following logical groups:
A service is a user-defined group of endpoints and, optionally, specific ports that have a singular purpose in the network. This grouping can also be used to define subsets of the network that are managed by specific teams or groups, enabling clear ownership and responsibility. For example:
service-environment-role-index: WEB-PROD-SE-002service-role-environment: ACCOUNTING-DB-PRODcluster-service-instance: CLUSTER3-STORAGE-01
A location is a user-defined group of endpoints that identify a physical location within your network topology. Locations can be nested, where one location is entirely contained within another, such as a data center rack, a hospital floor, or a specific building within a campus. For example:
region-datacenter-rackunit: US-WEST-DC1-R02U10geolocation-datacenter-rowrackunit: HKG-DC2-R01RK06U03
A monitoring point is a point in the network where the monitoring stack captures packets, typically a TAP, SPAN port, or remote SPAN such as ERSPAN, VXLAN, or GRE tunnel. Each monitoring point is uniquely identified by a combination of a cStor and a packet brokering port, such as 'Hoboken FW1 External'. Sources for this identifier include VLANs, cVu ports, or GENEVE VNI.
A protocol is the combination of TCP or UDP and a port number used to identify a specific application, also known as a network application. For example, DNS uses port 53, and HTTPS uses port 443.
Configure analytics labels using services
Use the following procedure to configure analytics labels using custom services. If services are undefined, they default to the following IP types: global, private, loopback, local, singletons, multicast, or broadcast. See Default IP types for default service name CIDR blocks.
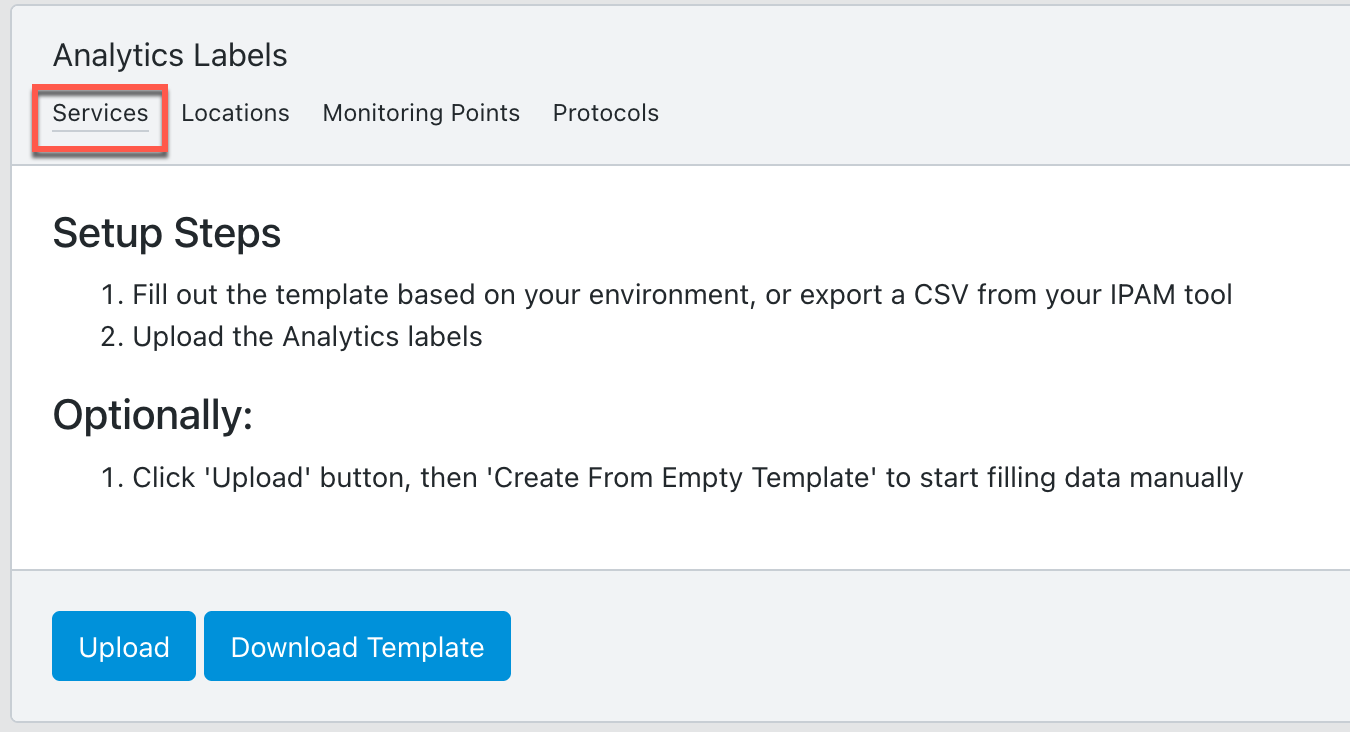
Go to Configure > Network Monitors > Analytics Labels and select the Services tab.
The initial configuration can be done manually or more conveniently by uploading a CSV file. This file can either be from another cClear device or exported from your IPAM tool. For more information, see Download an analytics label template.
The CSV file needs to contain the following information:
Setting
Value
Service Name
Enter a service name.
IP/CIDR
Enter the comma-separated IP address, CIDR block, or IP range for your service. Use IPv4 format and hyphen separate ranges. For example: 20.70.80.0/24, 10.70.80.20-10.70.80.50.
IP addresses cannot overlap. Each subset must be fully contained and fall within the defined IP range.
Port
Optional: Enter the comma-separated port or port range for your service. Port ranges should be hyphen separated. For example: 2598, 1500-1590.
Protocol
Select All, TCP, or UDP from the drop-down menu. TCP is the default value.
Exclude
Select Yes or No from the drop-down menu. No is the default value. When exclude is set to Yes, the IP address, CIDR block, or IP range is omitted from the dashboard metrics.
If you don't have a CSV file with your configuration, use the following sample file or Download an analytics label template from your cClear. Edit the information in the sample file based on your environment. Note the spacing necessary for the IP/CIDR formatting:
Service Name,IP / CIDR,Port,Protocol,Exclude
ACME Server,10.197.2.2/24,,ALL,FALSE
ACME Client,10.197.1.2/24,,ALL,FALSE
Exchange,"10.70.80.10, 10.70.80.20-10.70.80.50, 20.70.80.0/24","993, 995",TCP,FALSE
VOIP,30.70.80.0/24,"993, 995",UDP,FALSE
LDAP,40.70.80.20-40.70.90.20,3306,TCP,FALSE
Splunk,"50.70.80.10, 50.70.80.15","1494, 2598",TCP,FALSE
Payment Processing,60.70.80.10,1500-1590,ALL,FALSE
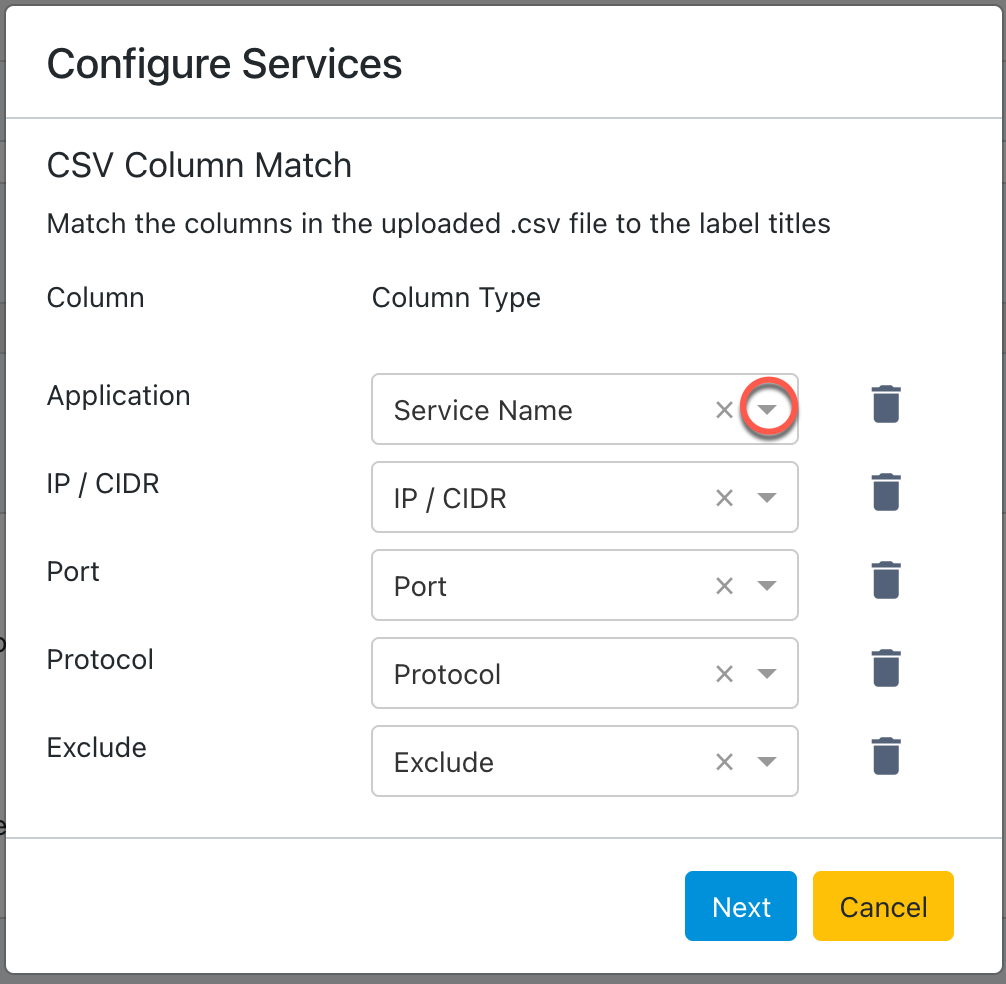
Click Upload > Choose File to upload the CSV configuration file.
Use the drop-down in each Column Type field to match the label settings to the columns in the uploaded CSV file, and then click Next.
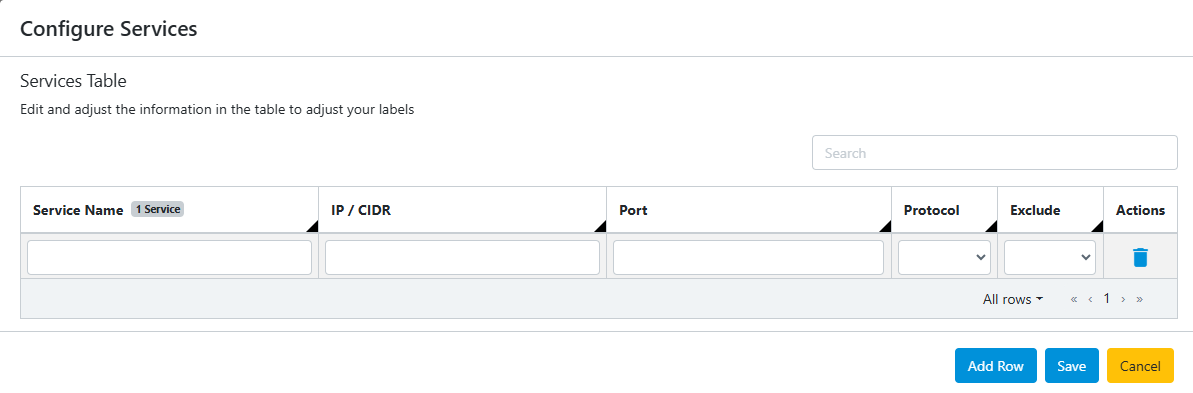
Edit any of the information in the table to adjust your labels. To add an additional label, click Add Row. To remove a label, click delete
 in the Actions column.
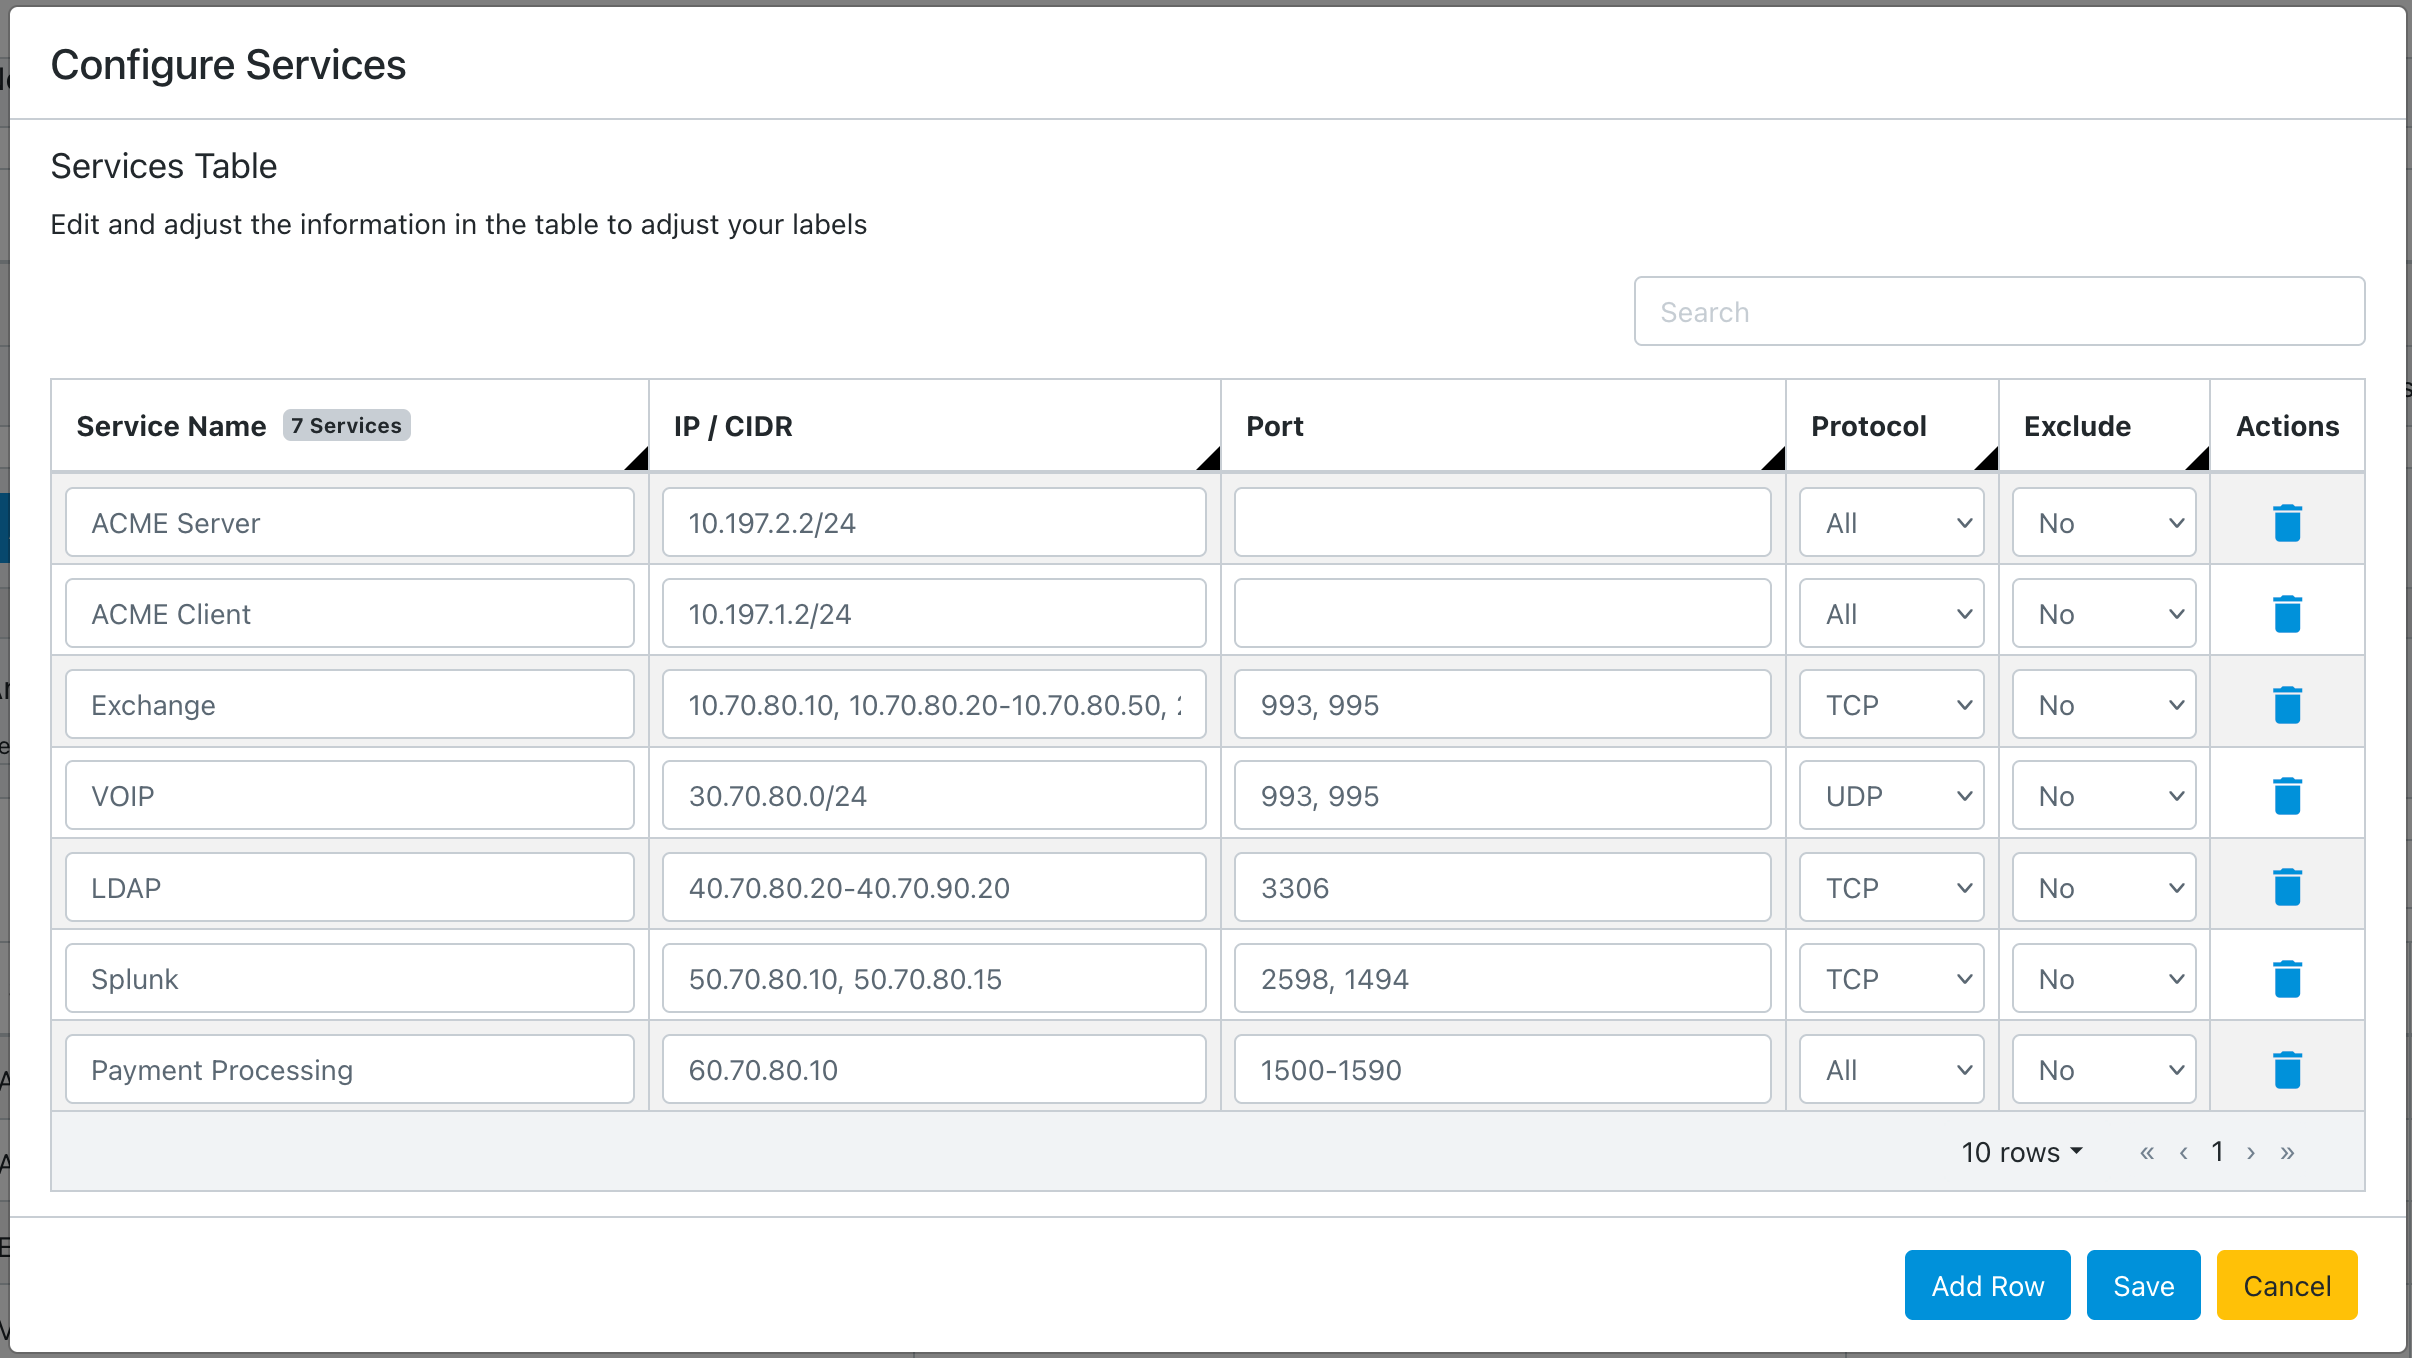
When you finish editing, click Save.
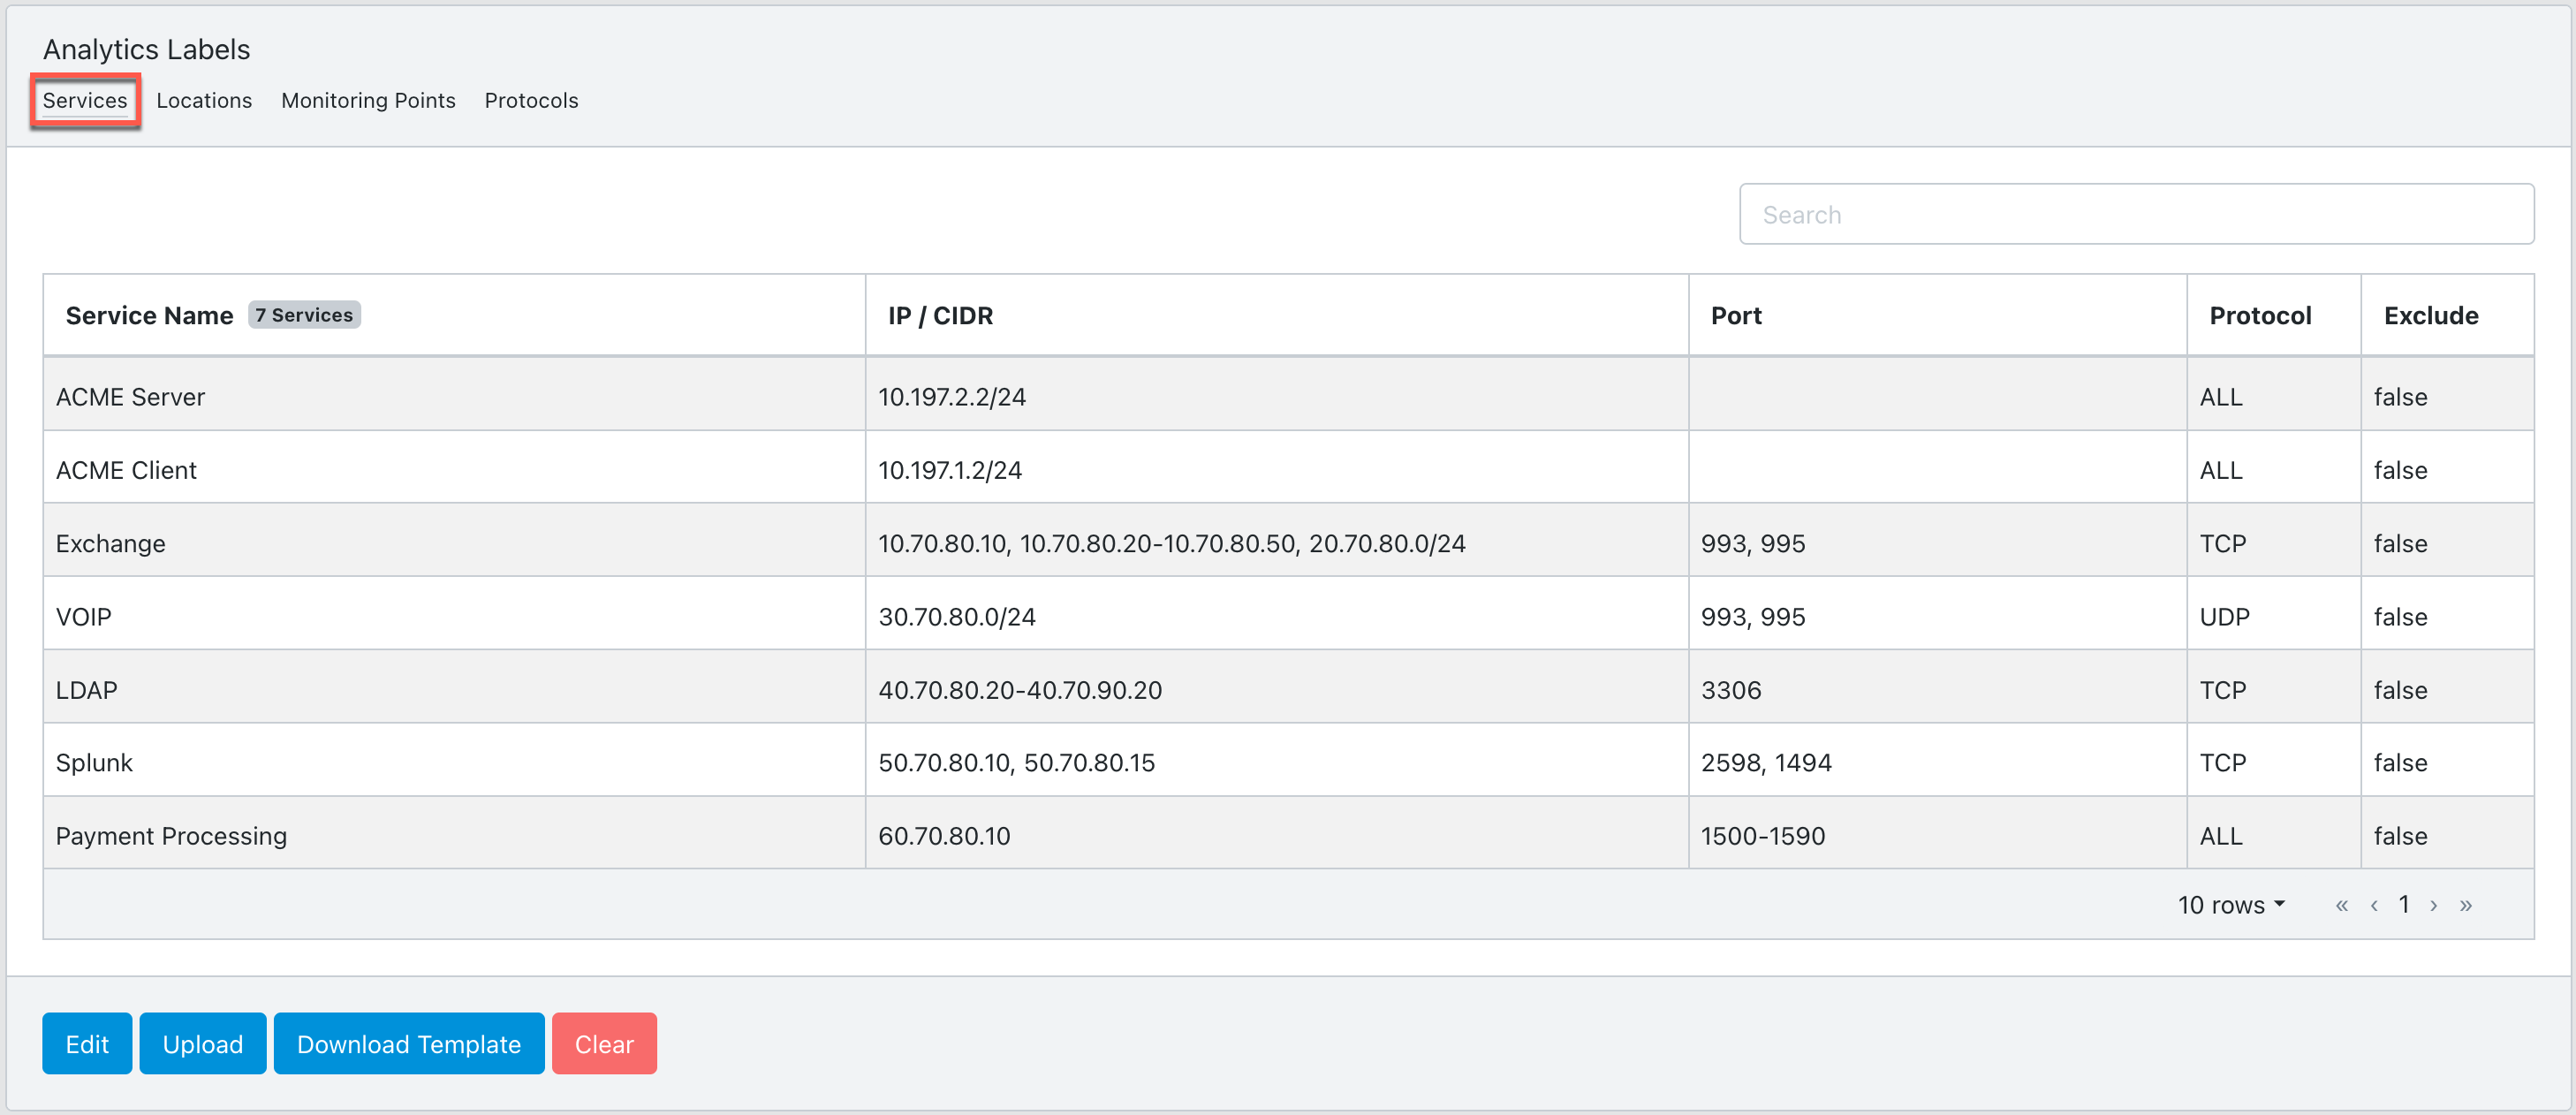
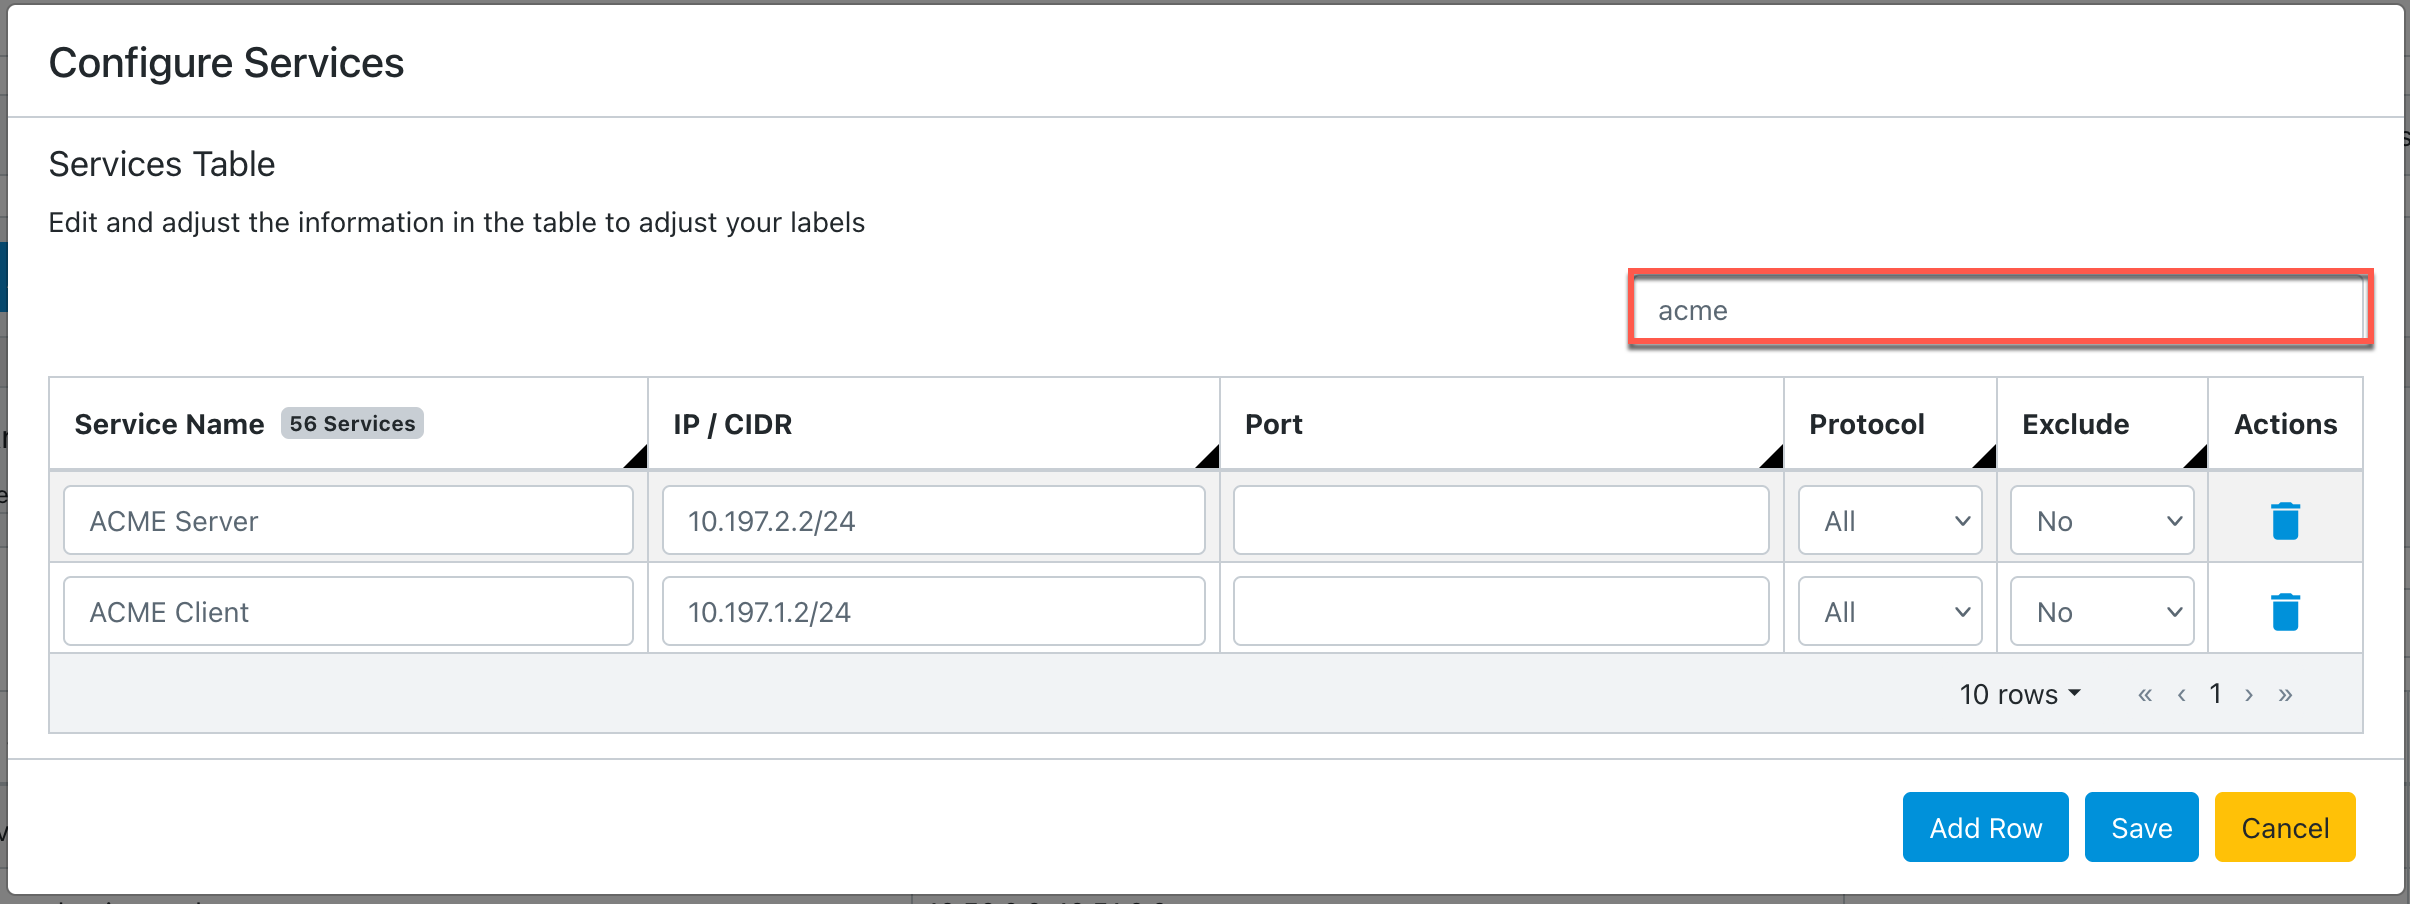
Configured services are displayed.
Alternatively, you can enter the label configuration manually using the cClear UI. Click Upload > Create From Empty Template. Enter the values from the table in Step 2 and click Save.
Click Edit to add, modify, or delete individual labels.
Use the search bar on the Services Table to find the label you are looking for quickly.
Configure analytics labels using locations
Use the following procedure to configure analytics labels using custom locations. If locations are undefined, they default to the following IP types: global, private, loopback, local, singletons, multicast, or broadcast. See Default IP types for default location name CIDR blocks.
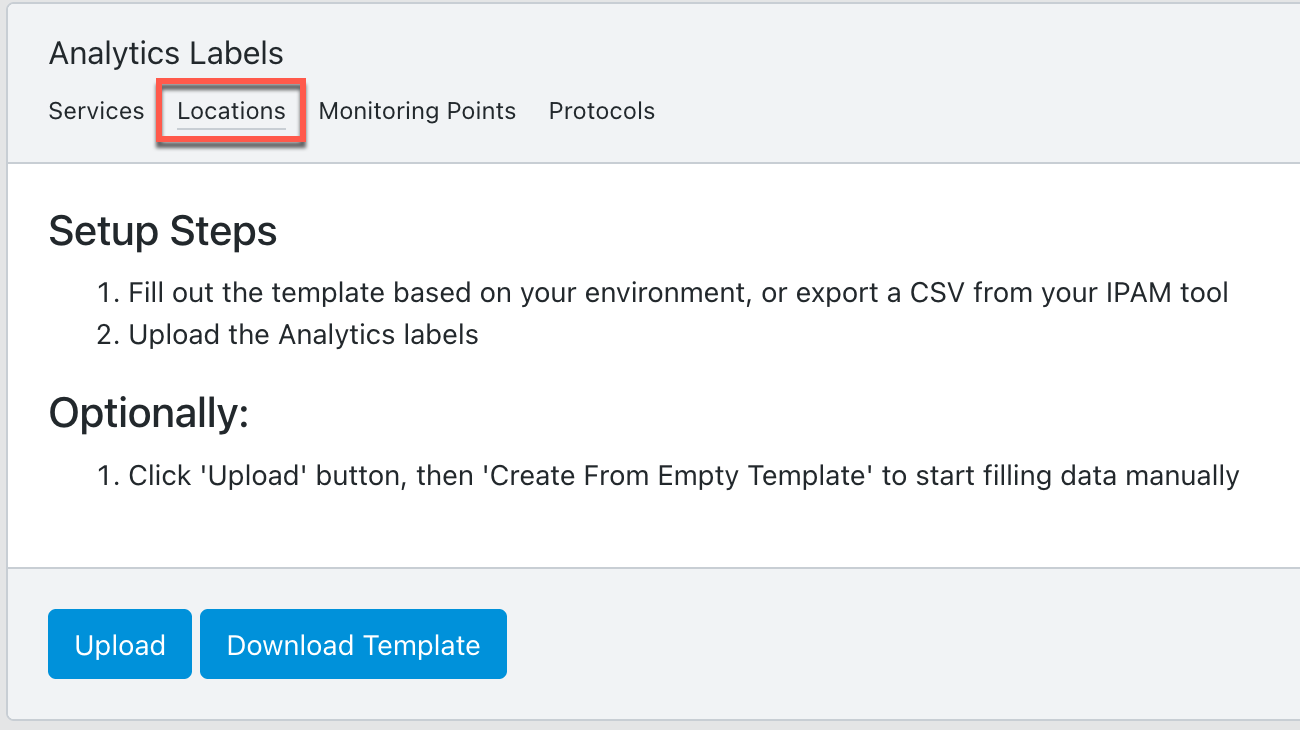
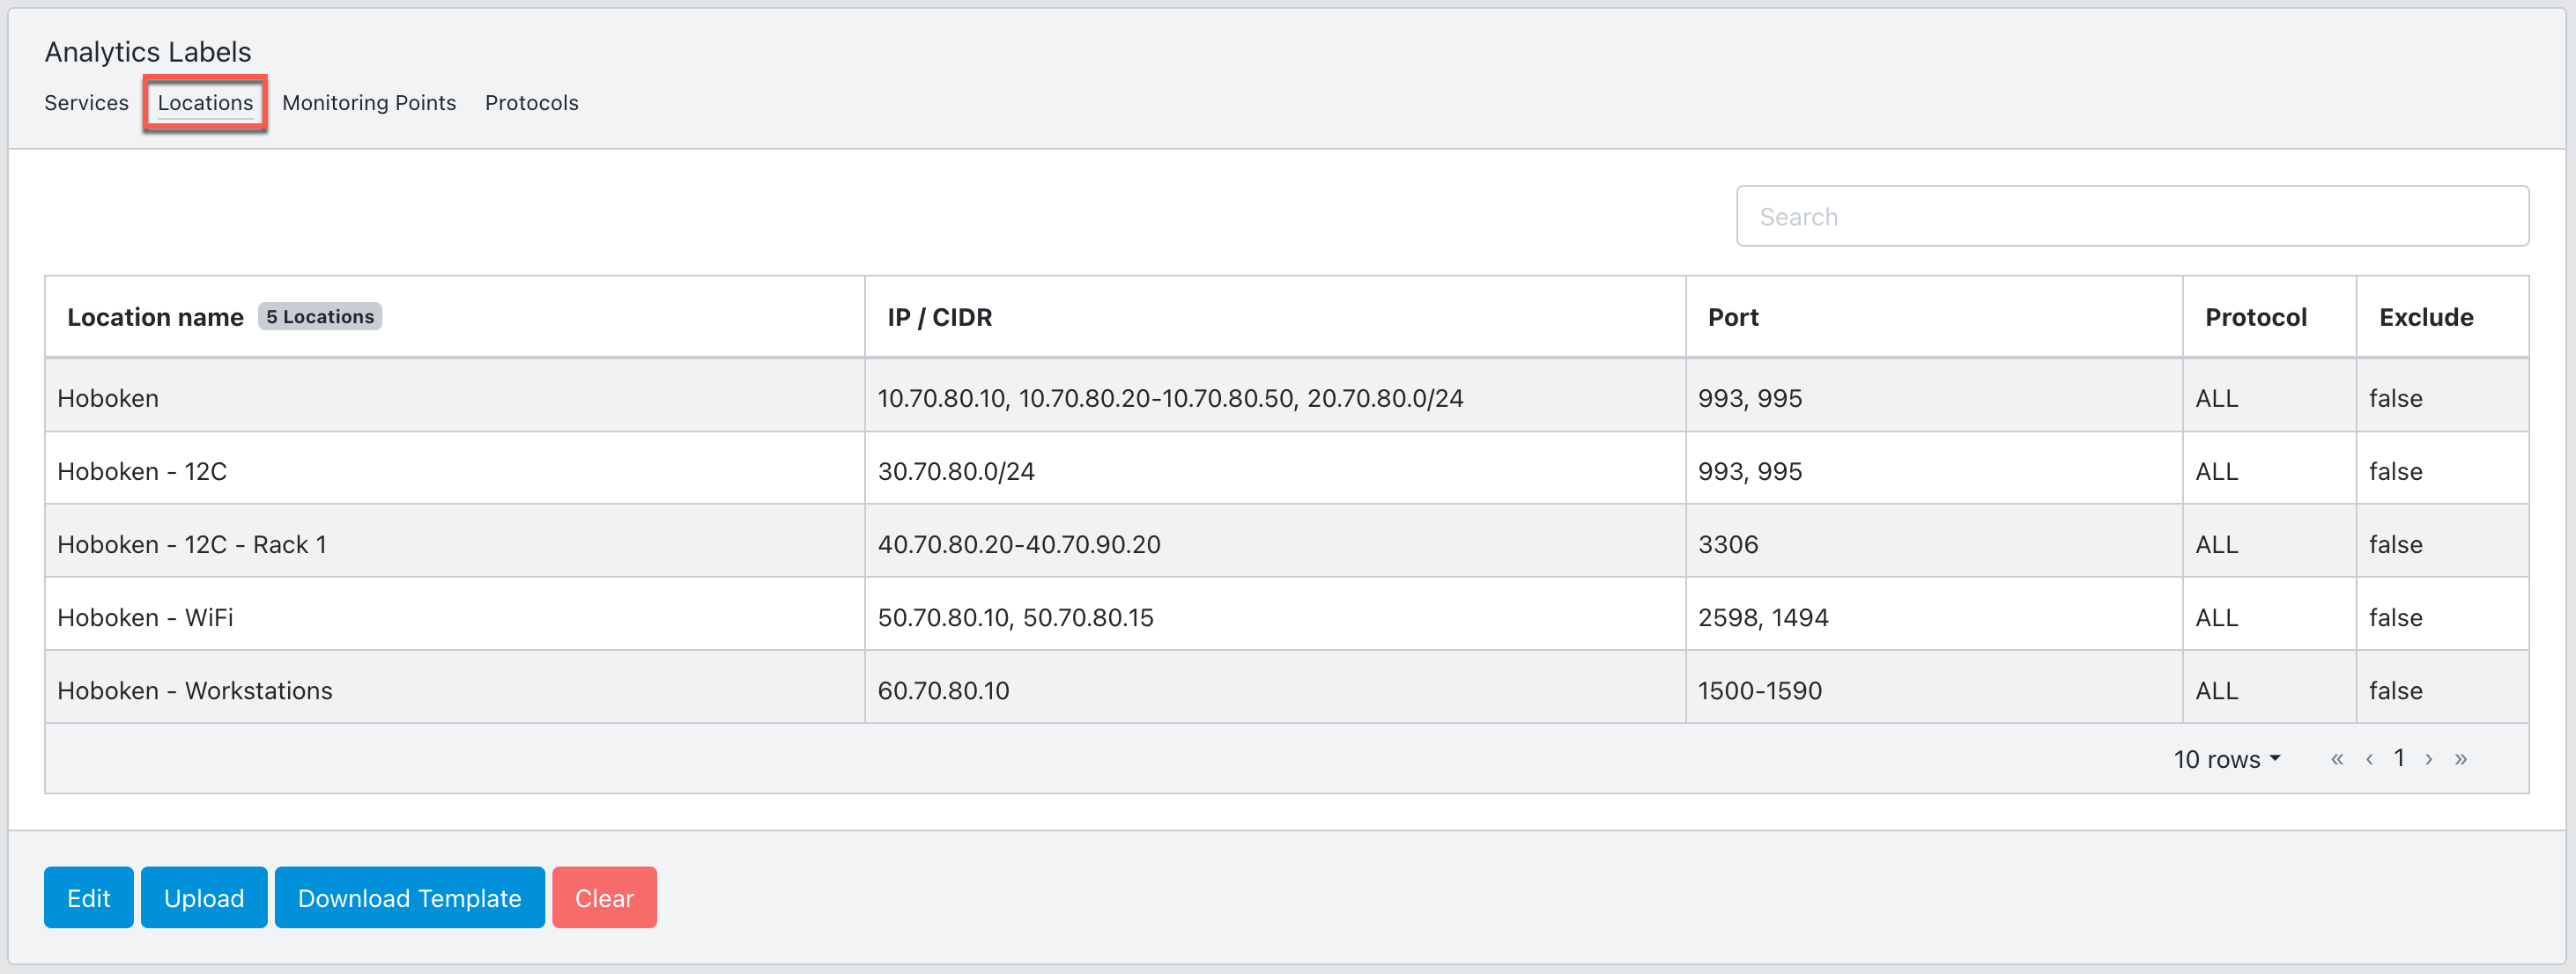
Go to Configure > Network Monitors > Analytics Labels and select the Locations tab.
The initial configuration is input by uploading a CSV file. This file can either be from another cClear device or exported from your IPAM tool. For more information, see Download an analytics label template.
The CSV file needs to contain the following information:
Setting
Value
Location Name
Enter a location name.
IP/CIDR
Enter the comma-separated IP address, CIDR block, or IP range for your location. Use IPv4 format and hyphen separate ranges. For example: 20.70.80.0/24, 10.70.80.20-10.70.80.50.
IP addresses cannot overlap. Each subset must be fully contained and fall within the defined IP range.
Port
Optional: Enter the comma-separated port or port range for your location. Port ranges should be hyphen separated. For example: 2598, 1500-1590.
Protocol
Select All, TCP, or UDP from the drop-down menu. TCP is the default value.
Exclude
Select Yes or No from the drop-down menu. No is the default value. When exclude is set to Yes, the IP address, CIDR block, or IP range is omitted from the dashboard metrics.
If you don't have a CSV file with your configuration, use the following sample file or Download an analytics label template from your cClear. Edit the information in the sample file based on your environment. Note the spacing necessary for the IP/CIDR formatting:
Location name,IP / CIDR,Port,Protocol,Exclude
Hoboken,"10.70.80.10, 10.70.80.20-10.70.80.50, 20.70.80.0/24","993, 995",ALL,FALSE
Hoboken - 12C,30.70.80.0/24,"993, 995",ALL,FALSE
Hoboken - 12C - Rack 1,40.70.80.20-40.70.90.20,3306,ALL,FALSE
Hoboken - WiFi,"50.70.80.10, 50.70.80.15","1494, 2598",ALL,FALSE
Hoboken - Workstations,60.70.80.10,1500-1590,ALL,FALSE
Click Upload > Choose File to upload the CSV configuration file:
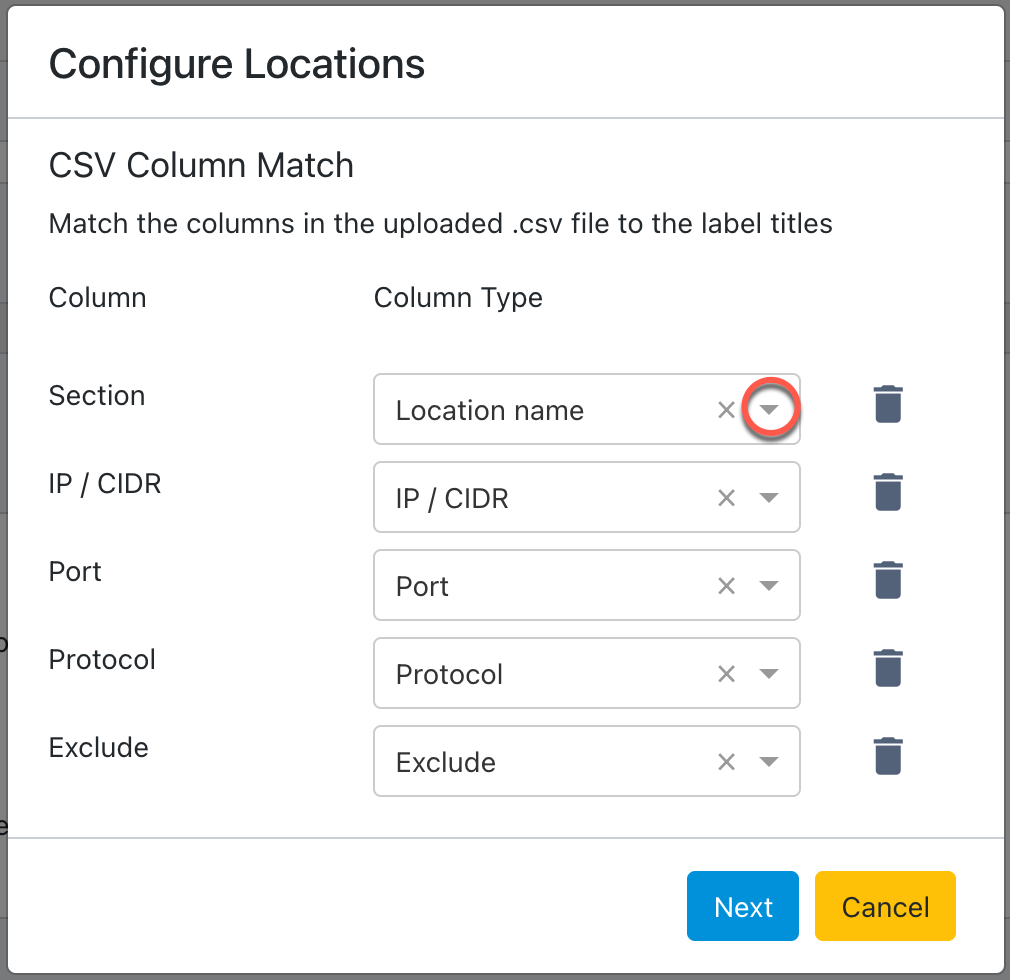
Use the drop-down in each Column Type field to match the label settings to the columns in the uploaded CSV file, and then click Next.
Edit any of the information in the table to adjust your labels. To add an additional label, click Add Row. To remove a label, click delete
in the Actions column.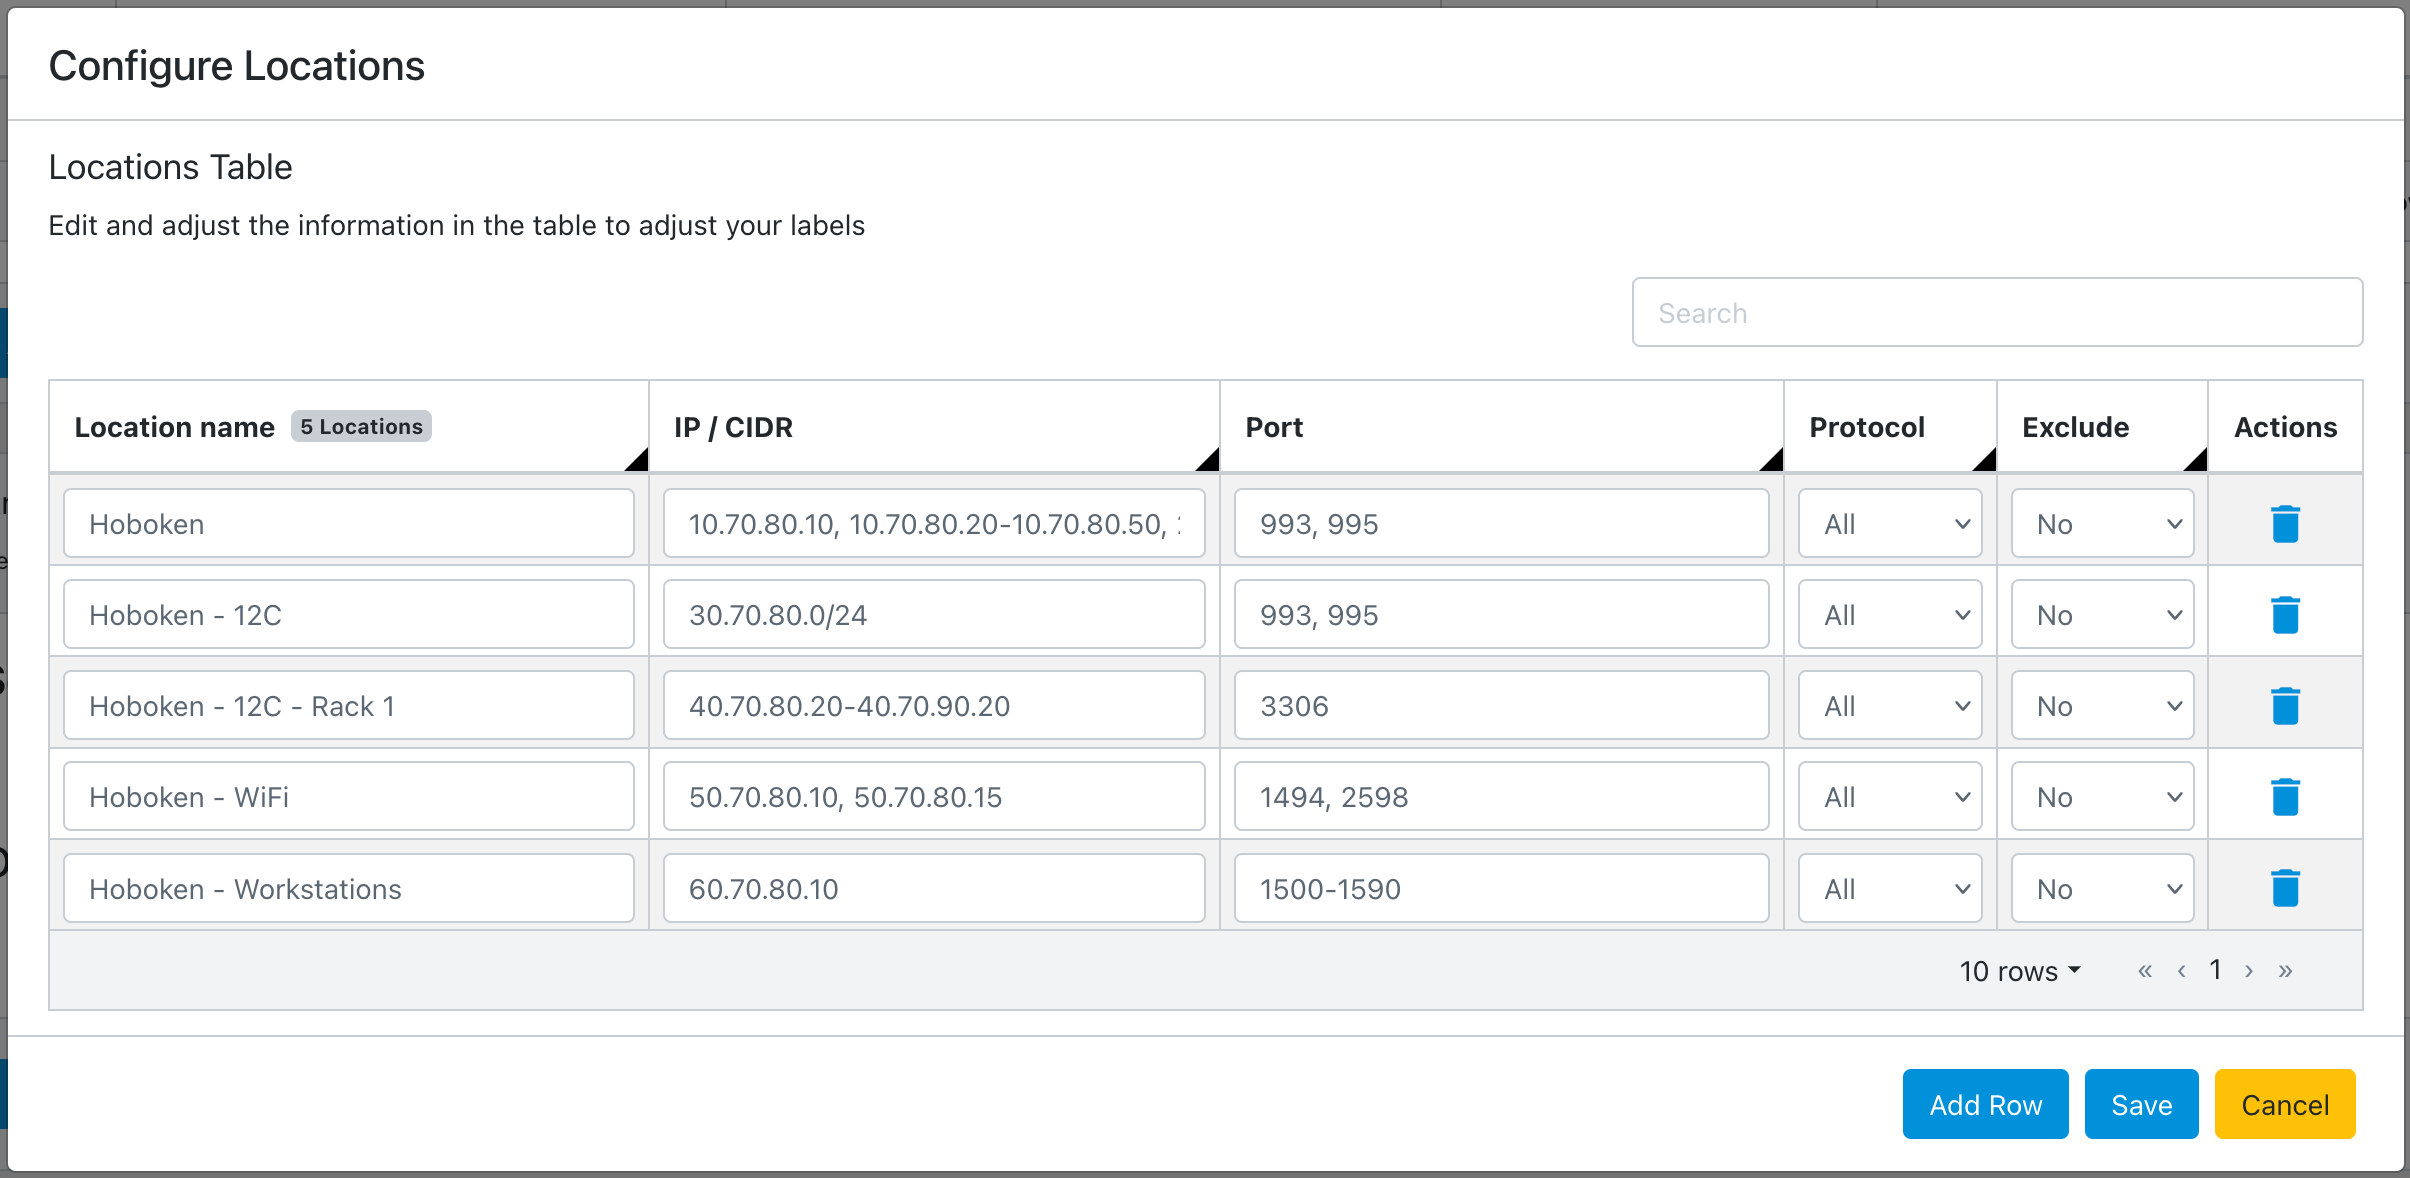
When you finish editing, click Save.
Configured locations are displayed:
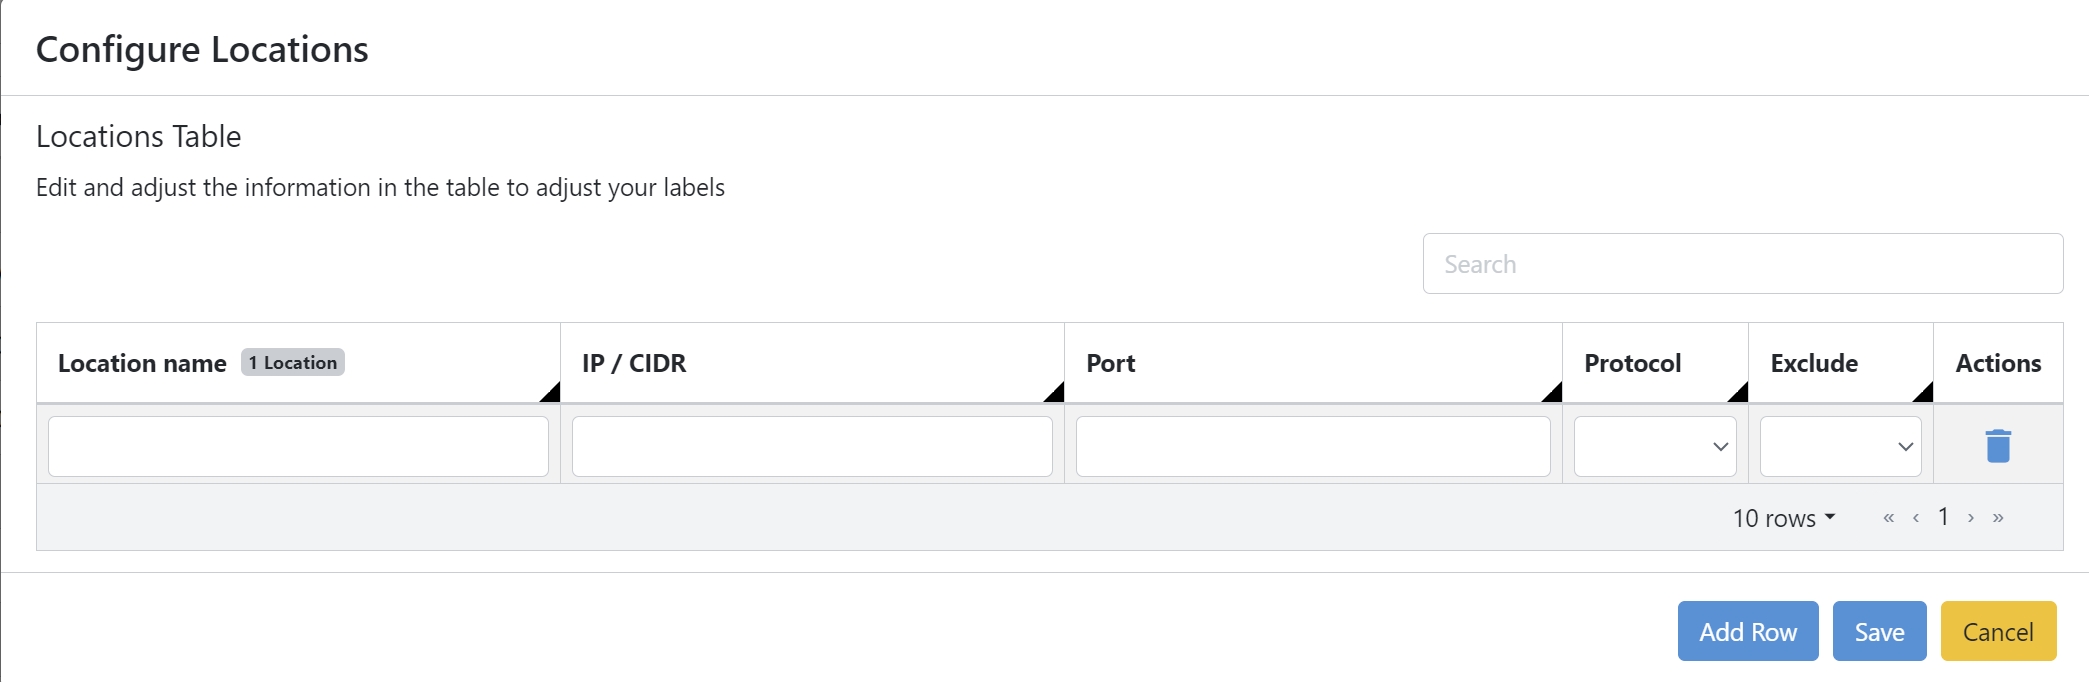
Alternatively, you can enter the label configuration manually using the cClear UI. Click Upload > Create From Empty Template. Enter the values from the table in Step 2 and click Save.
Click Edit to add, modify, or delete individual labels.
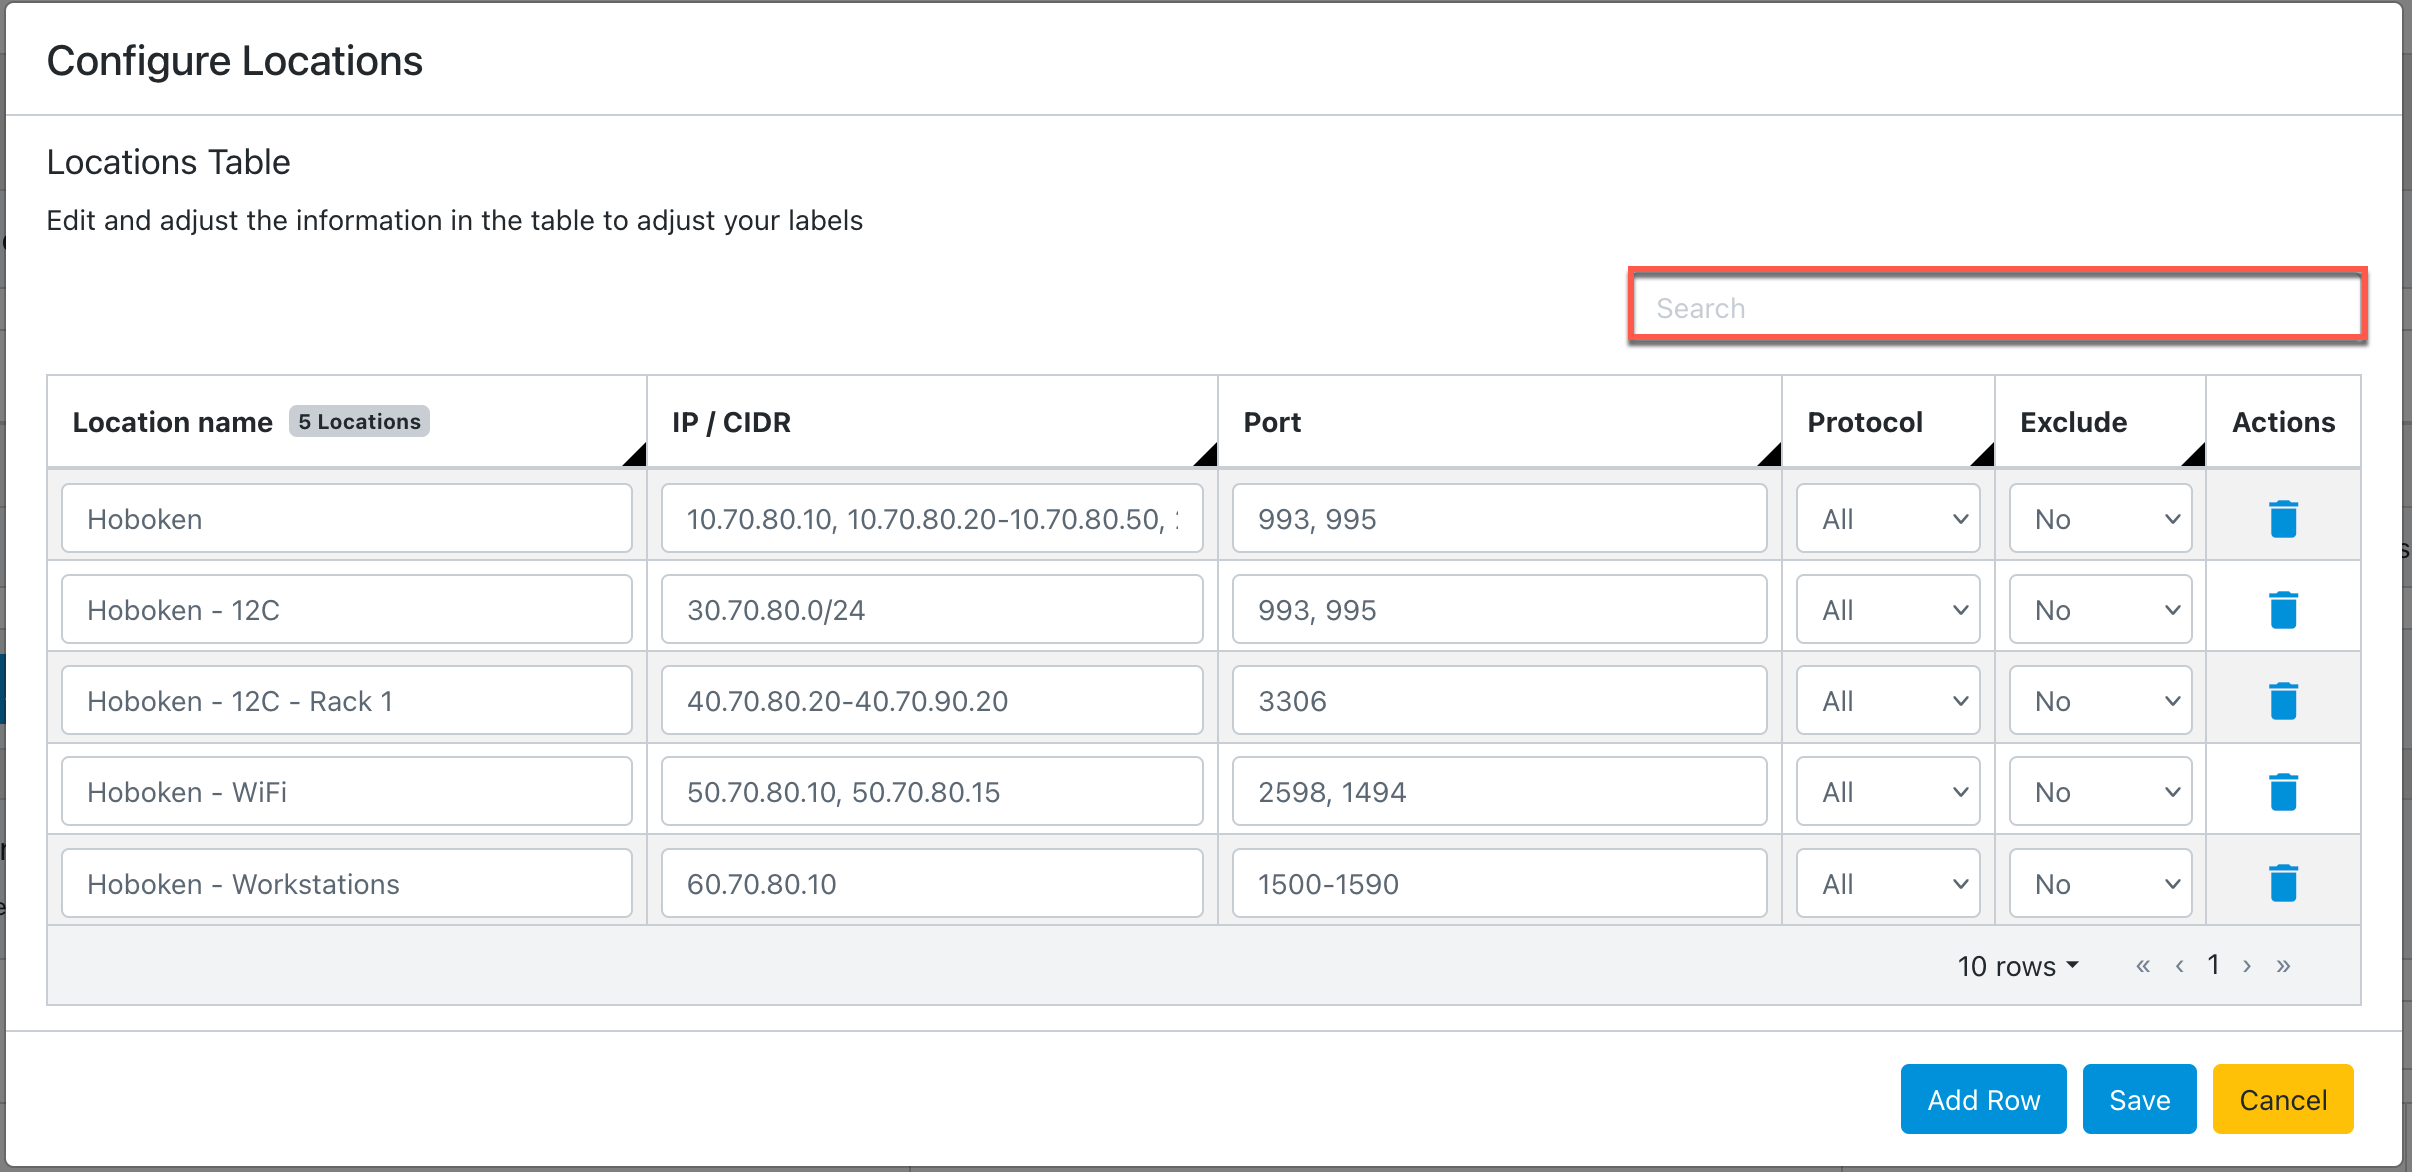
Use the search bar on the Locations Table to find the label you are looking for quickly.
Configure analytics labels using monitoring points
Use the following procedure to configure analytics labels using monitoring points. If monitoring points are undefined, they default to cstor_device_name|outer VLAN|inner VLAN. For example, CPSTH12R5U9|2001|0.
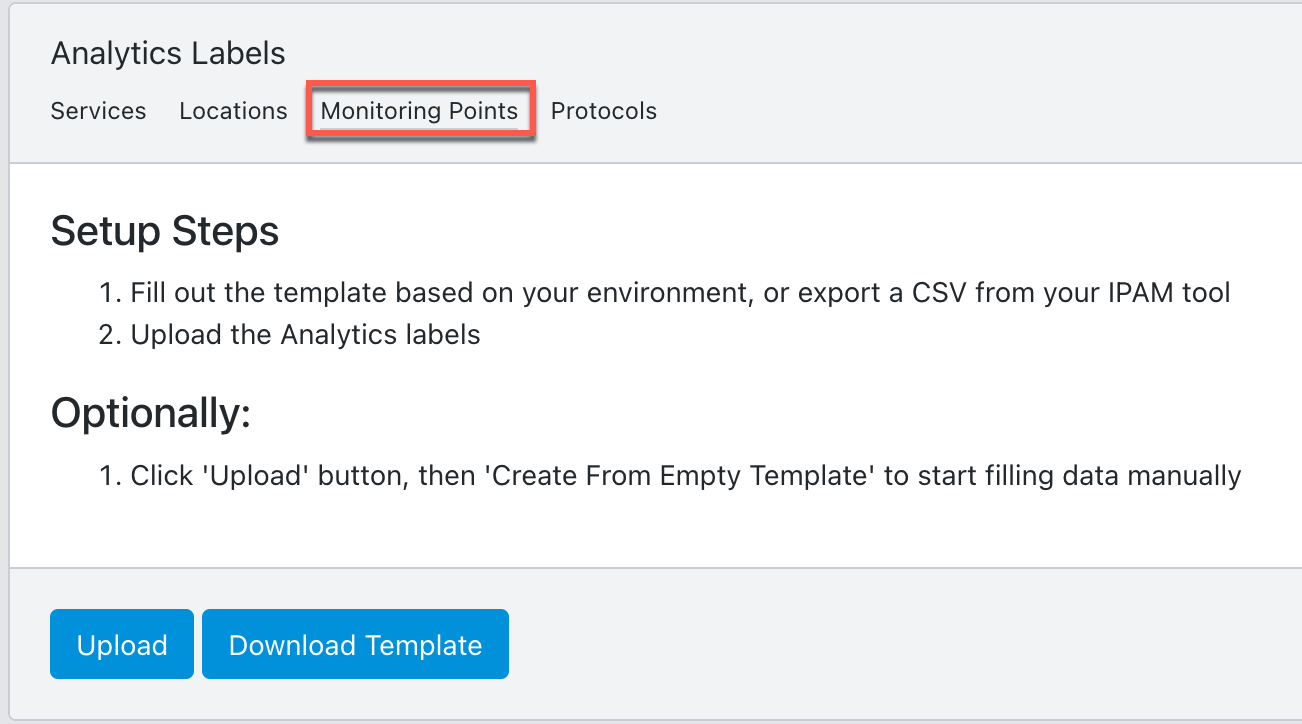
Go to Configure > Network Monitors > Analytics Labels and then select the Monitoring Points tab.
The initial configuration is input by uploading a CSV file. This file can either be from another cClear device or exported from your IPAM tool. For more information, see Download an analytics label template. Each record is required to contain at least one value in one of the following fields: cStor, Outer VLAN, or Inner VLAN.
The CSV file needs to contain the following information:
Setting
Value
Monitoring Point Name
Enter a new monitoring point name.
cStor
Optional: Enter the name of an existing cStor device on cClear.
Outer VLAN
Enter a valid VLAN ID between 0 and 4095. This field is optional and is ignored if left blank. Blank VLAN fields will display as 0 on the dashboards.
Inner VLAN
Enter a valid VLAN ID between 0 and 4095. This field is optional and is ignored if left blank. Blank VLAN fields will display as 0 on the dashboards.
If you don't have a CSV file with your configuration, use the following sample file or Download an analytics label template from your cClear. Edit the information in the sample file based on your environment. Note the spacing necessary for the IP/CIDR formatting:
Monitoring Point Name,cStor,Inner VLAN,Outer VLAN
Hoboken FW1 External,CPSTH12R5U9,2102,2302
Hoboken FW1 Internal,CPSTH12R5U9,,2304
Hoboken FW1 External,CPSTM18R6U4,2104,2306
Hoboken FW1 Internal,CPSTM18R6U4,,2308
AWS,CPSTVUSEV2,,
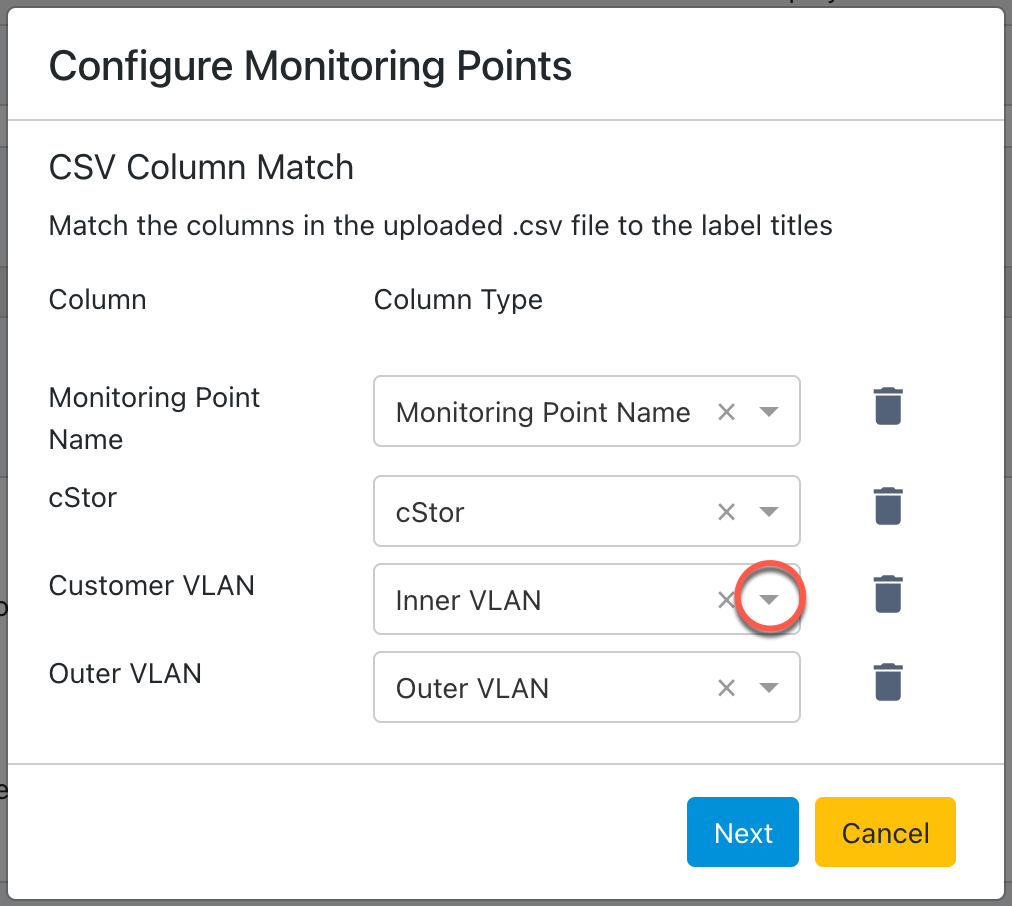
Click Upload > Choose File to upload the CSV configuration file.
Use the drop-down in each Column Type field to match the label settings to the columns in the uploaded CSV file, and then click Next.
Edit any of the information in the table to adjust your labels. To add an additional label, click Add Row. To remove a label, click delete
in the Actions column.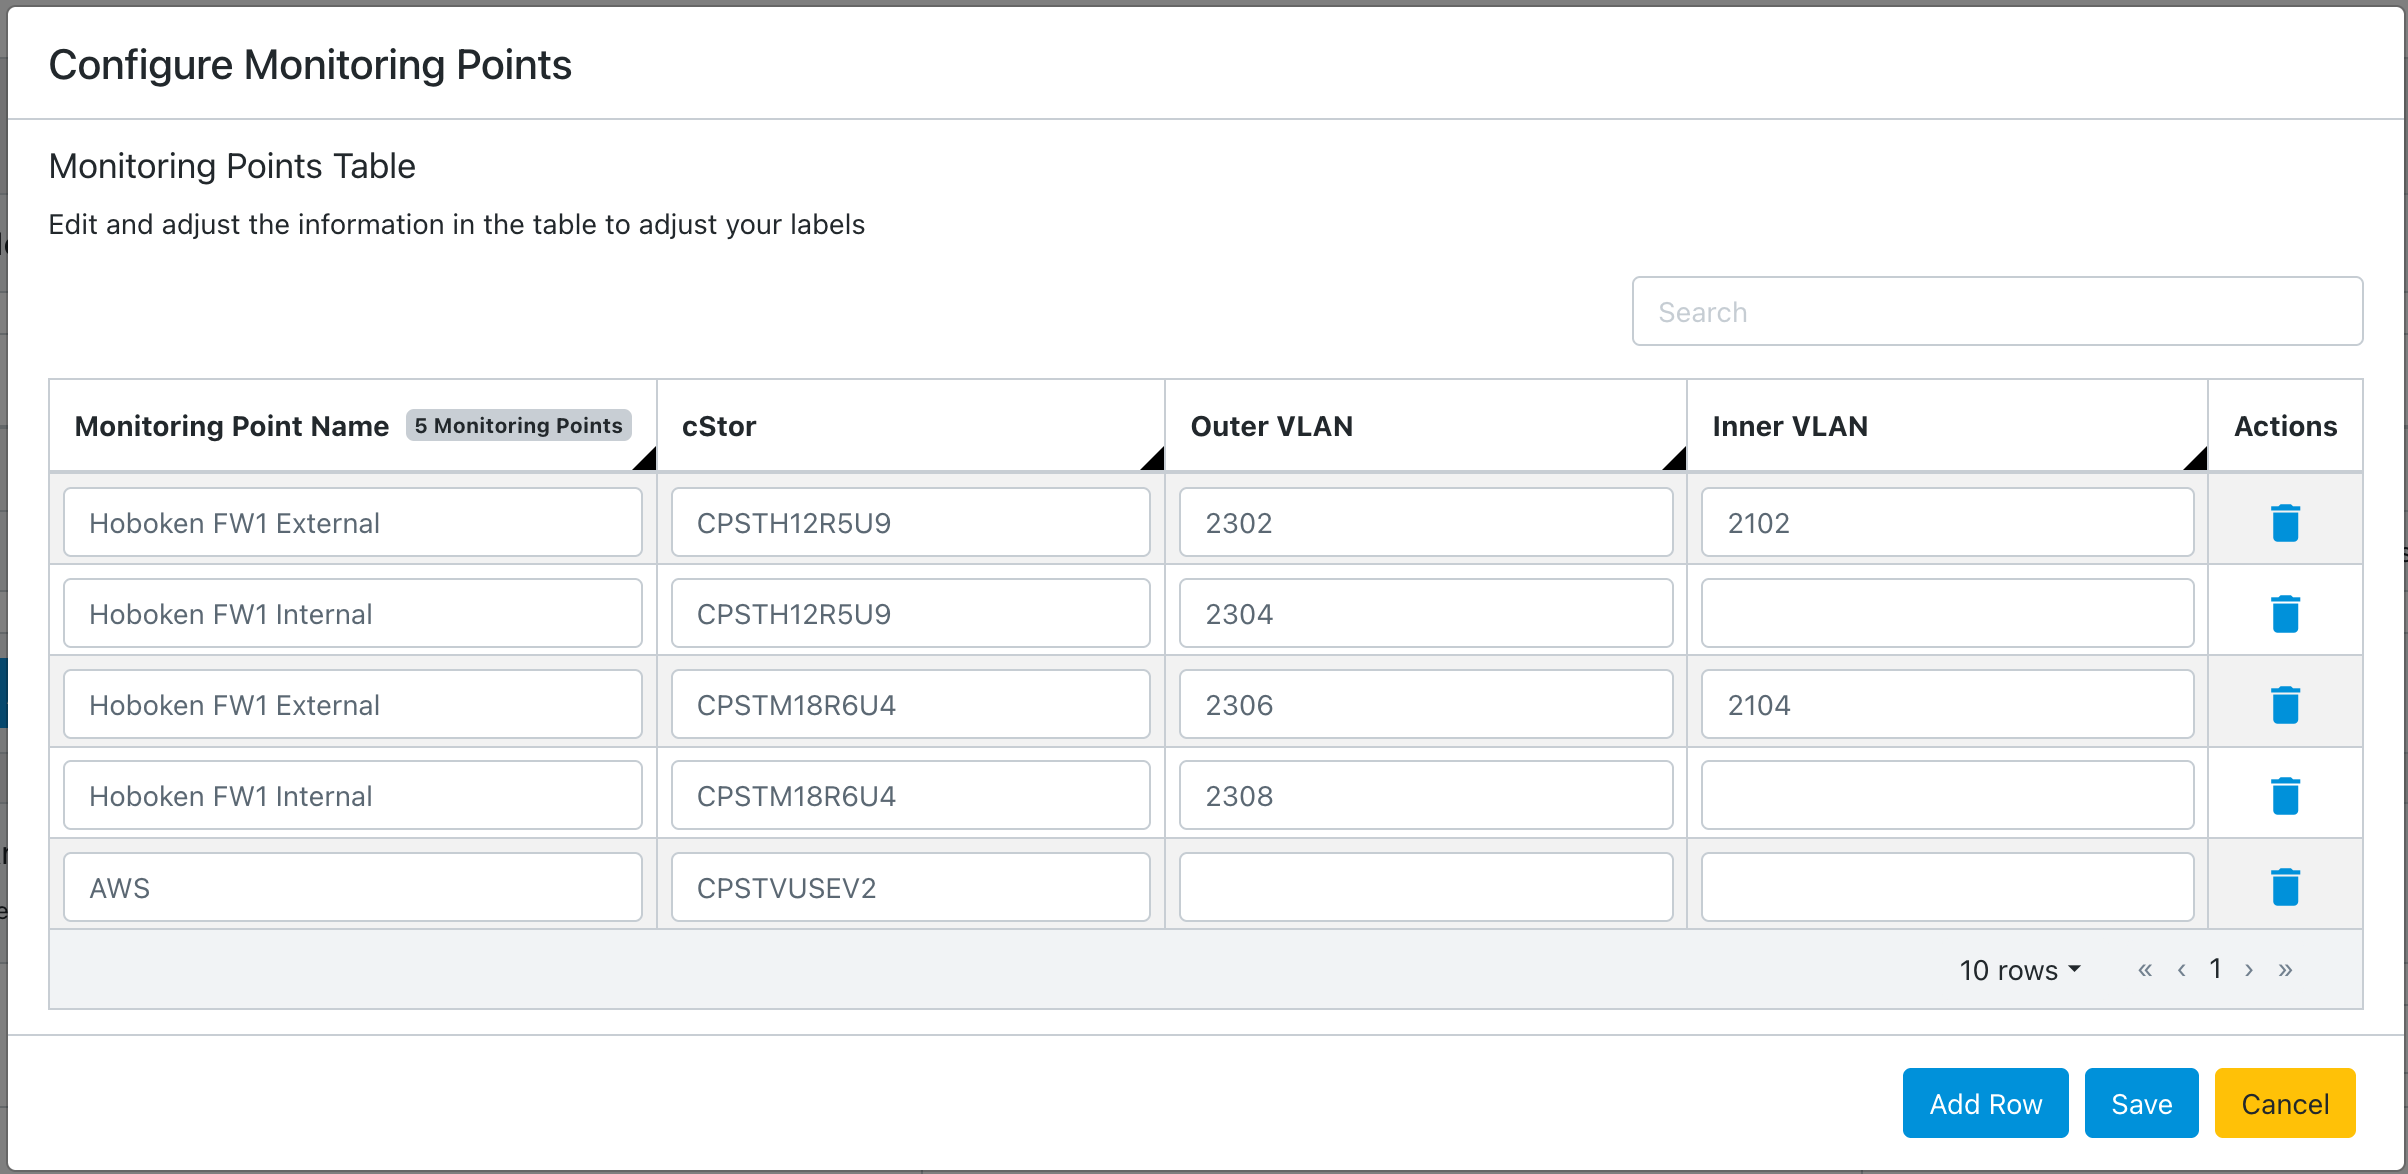
When you finish editing, click Save.
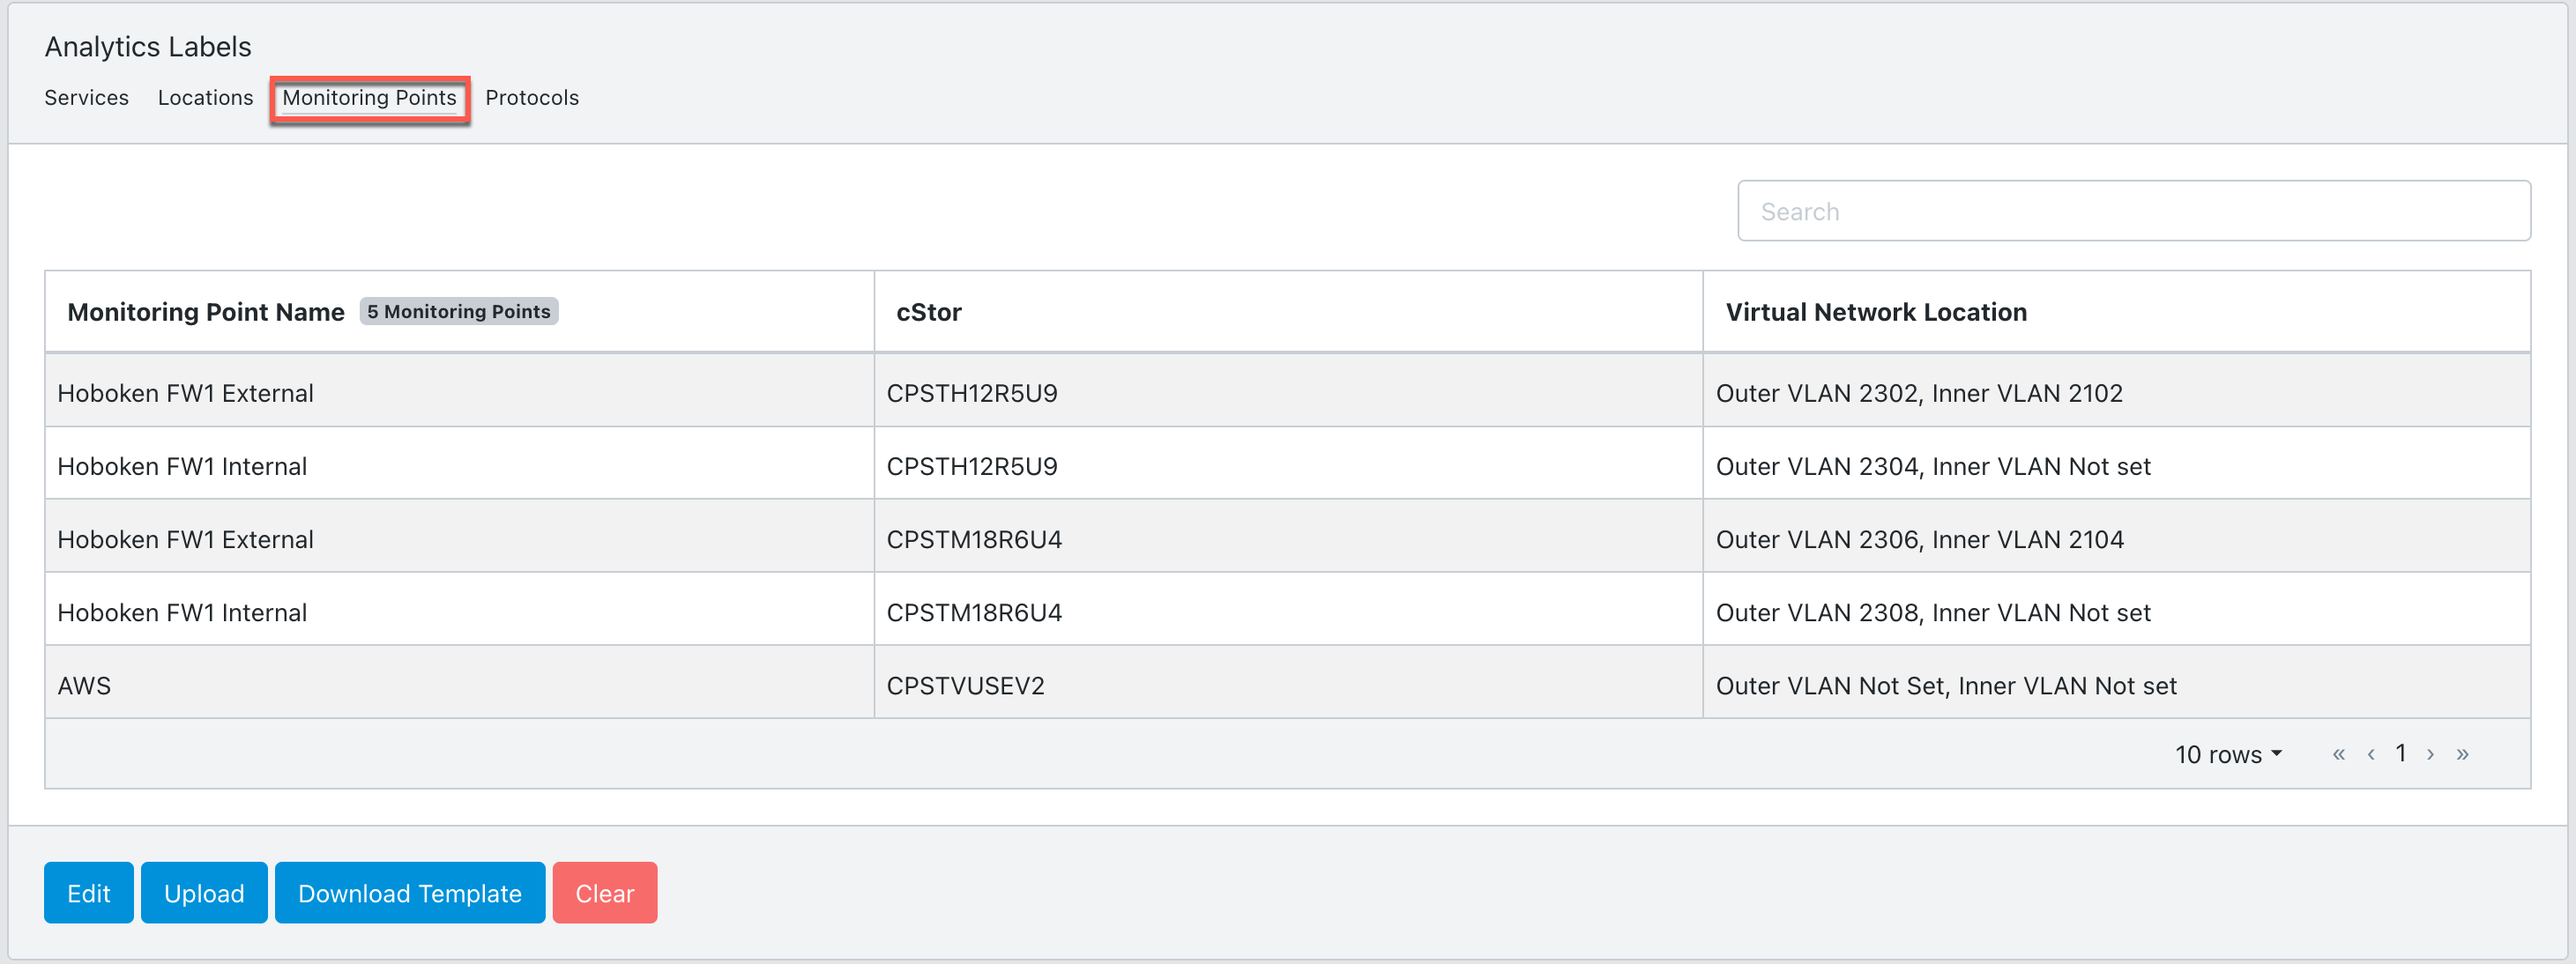
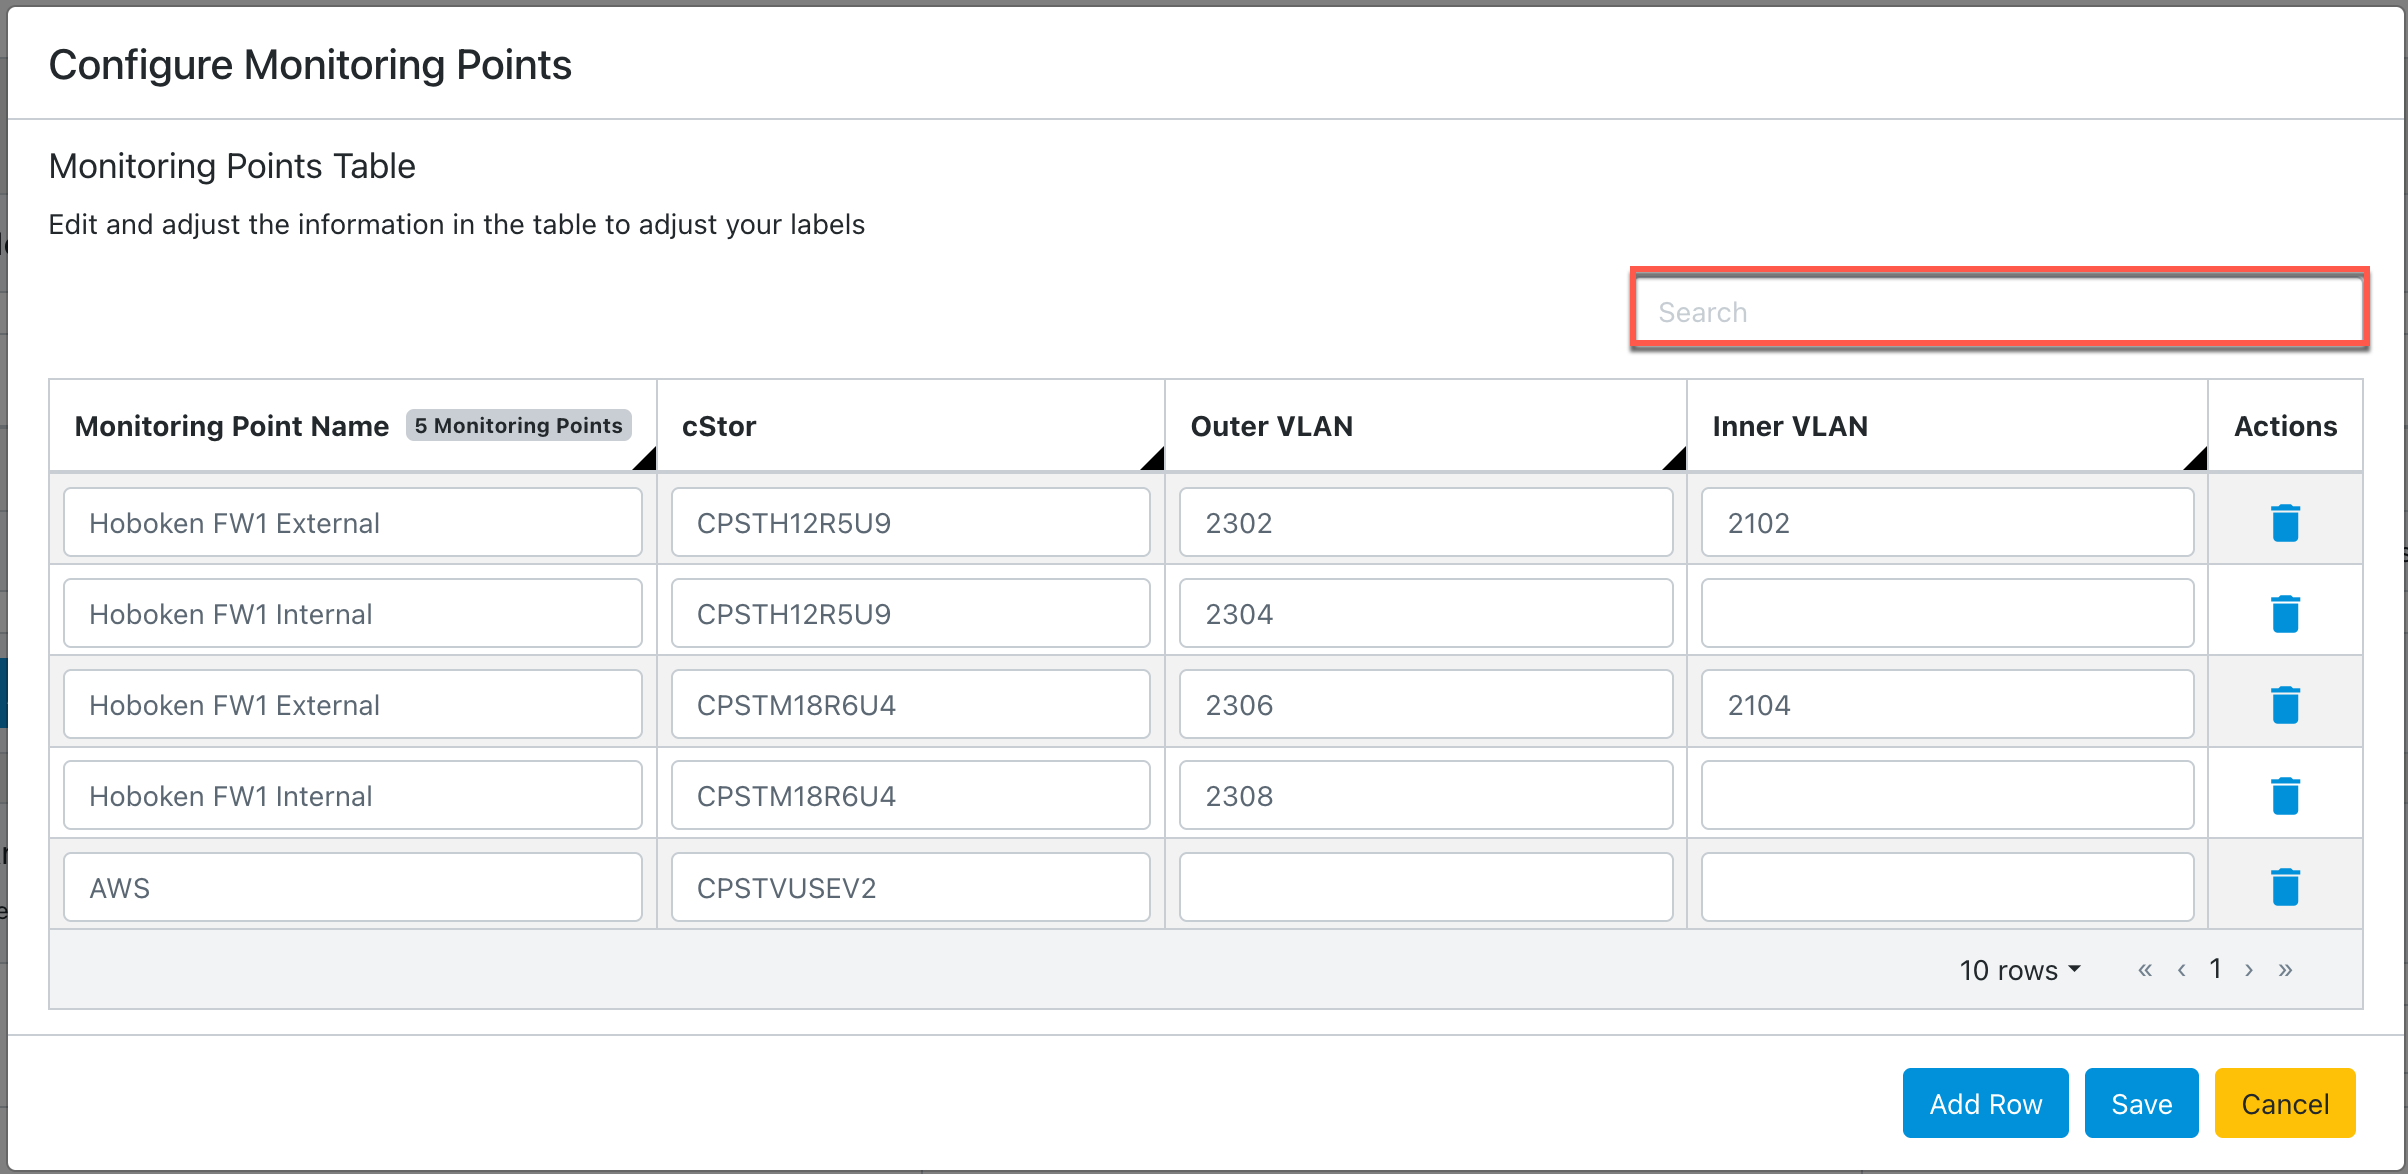
Configured monitoring points are displayed.
Alternatively, you can enter the label configuration manually using the cClear UI. Click Upload > Create From Empty Template. Enter the values from the table in Step 2 and click Save.
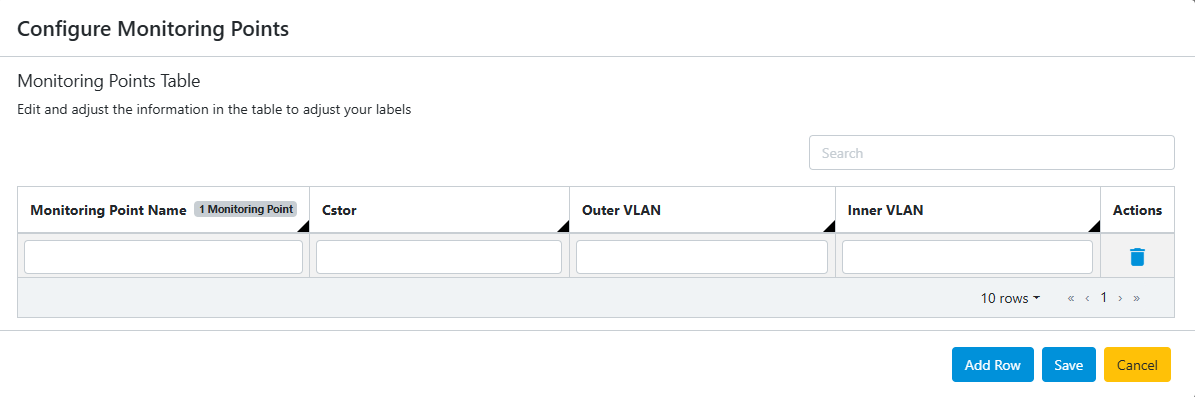
Click Edit to add, modify, or delete individual labels.
Use the search bar on the analytics labels panel to find the label you are looking for quickly.
Configure analytics labels using protocols
Use the following procedure to configure analytics labels using custom protocols. Defining custom protocols is optional. Standard TCP and UDP known ports used by protocols are added by default. See Default TCP protocols and Default UDP protocols for default port numbers and their associated protocols.
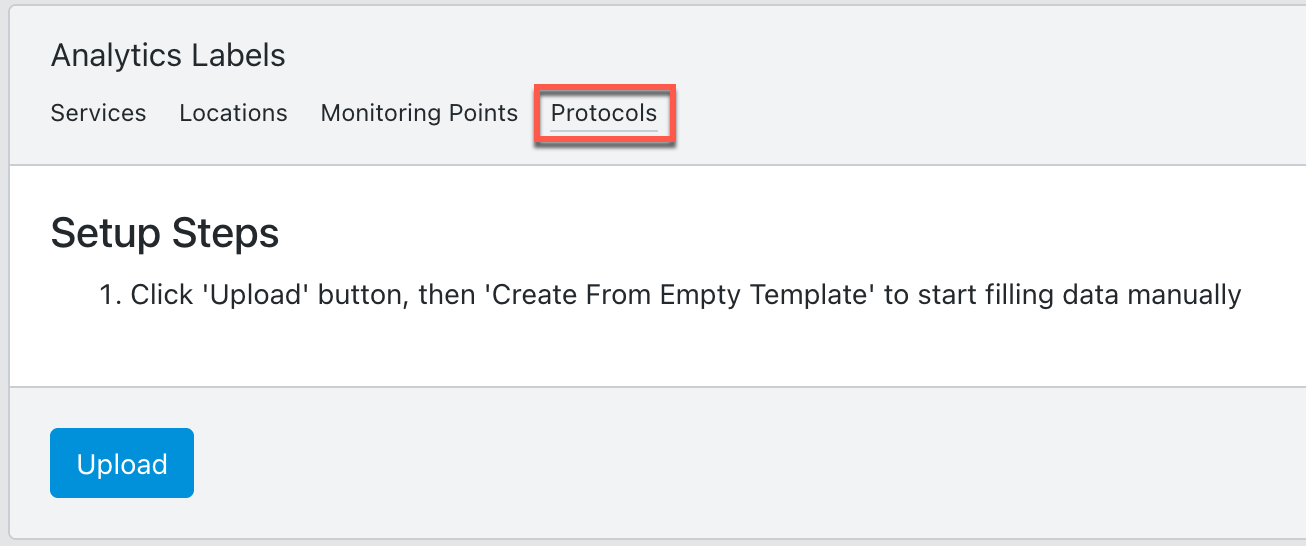
Go to Configure > Network Monitors > Analytics Labels and select the Protocols tab.
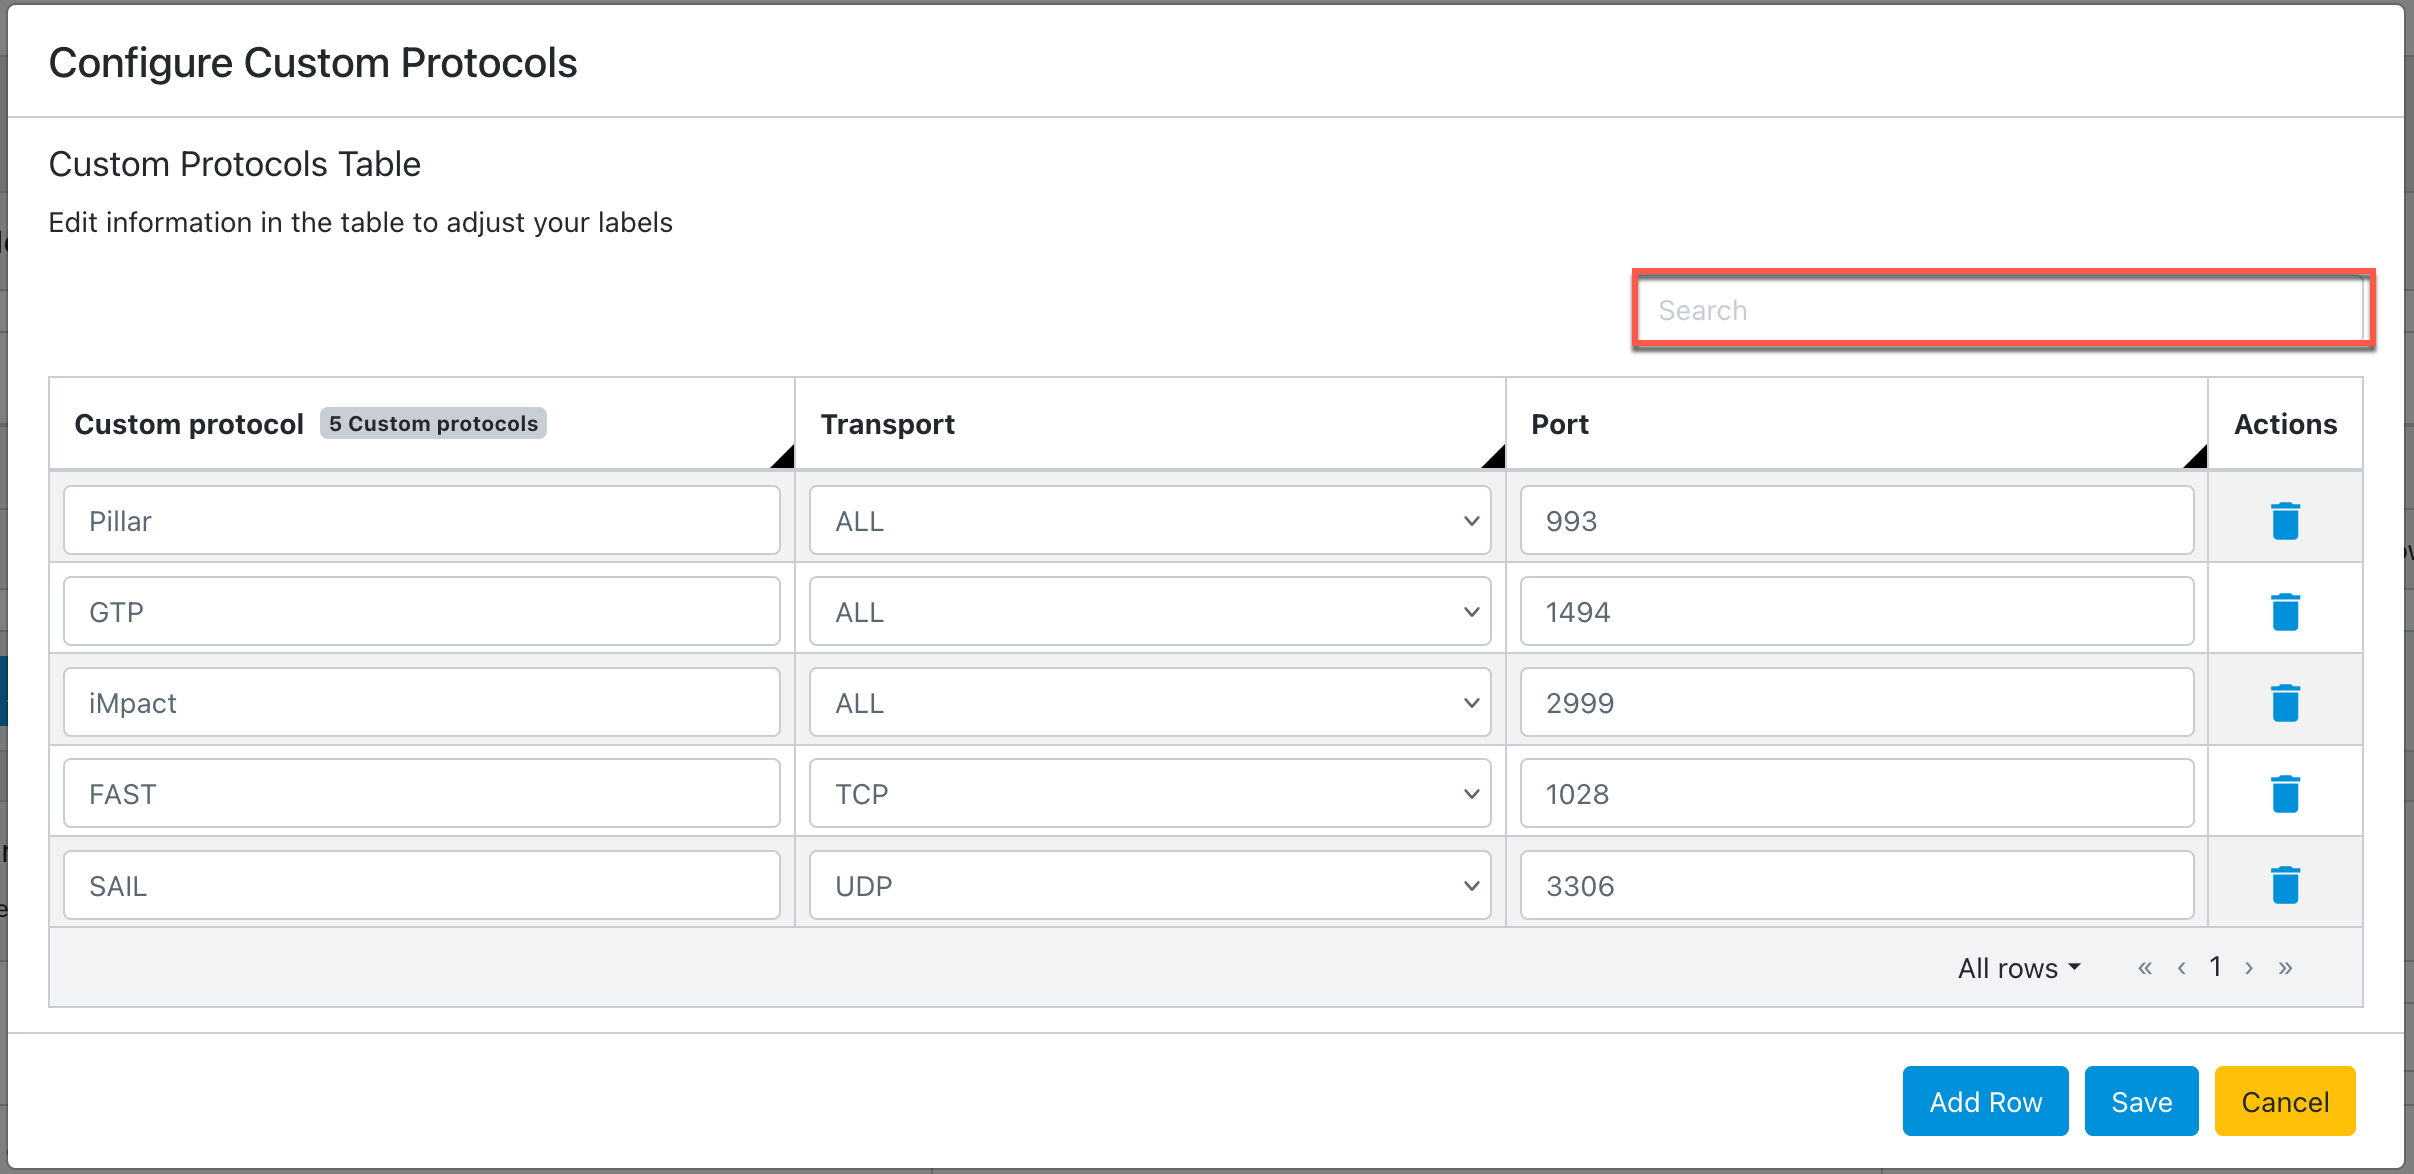
Click Upload > Create From Empty Template.
Enter or select the following information in the table:
Setting
Value
Custom protocol
Enter a new custom protocol name.
Transport
Select All, TCP, or UDP from the drop-down menu. TCP is the default value.
Port
Enter the port number.
To add an additional label, click Add Row. To remove a label, click delete
 in the Actions column.
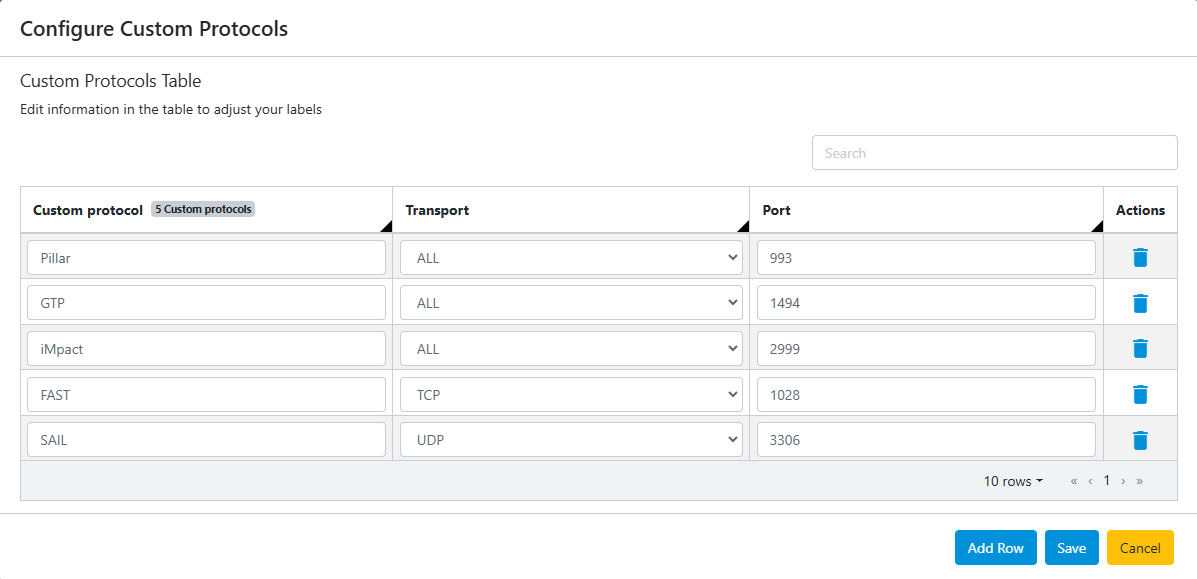
Click Save.
Configured custom protocols are displayed:
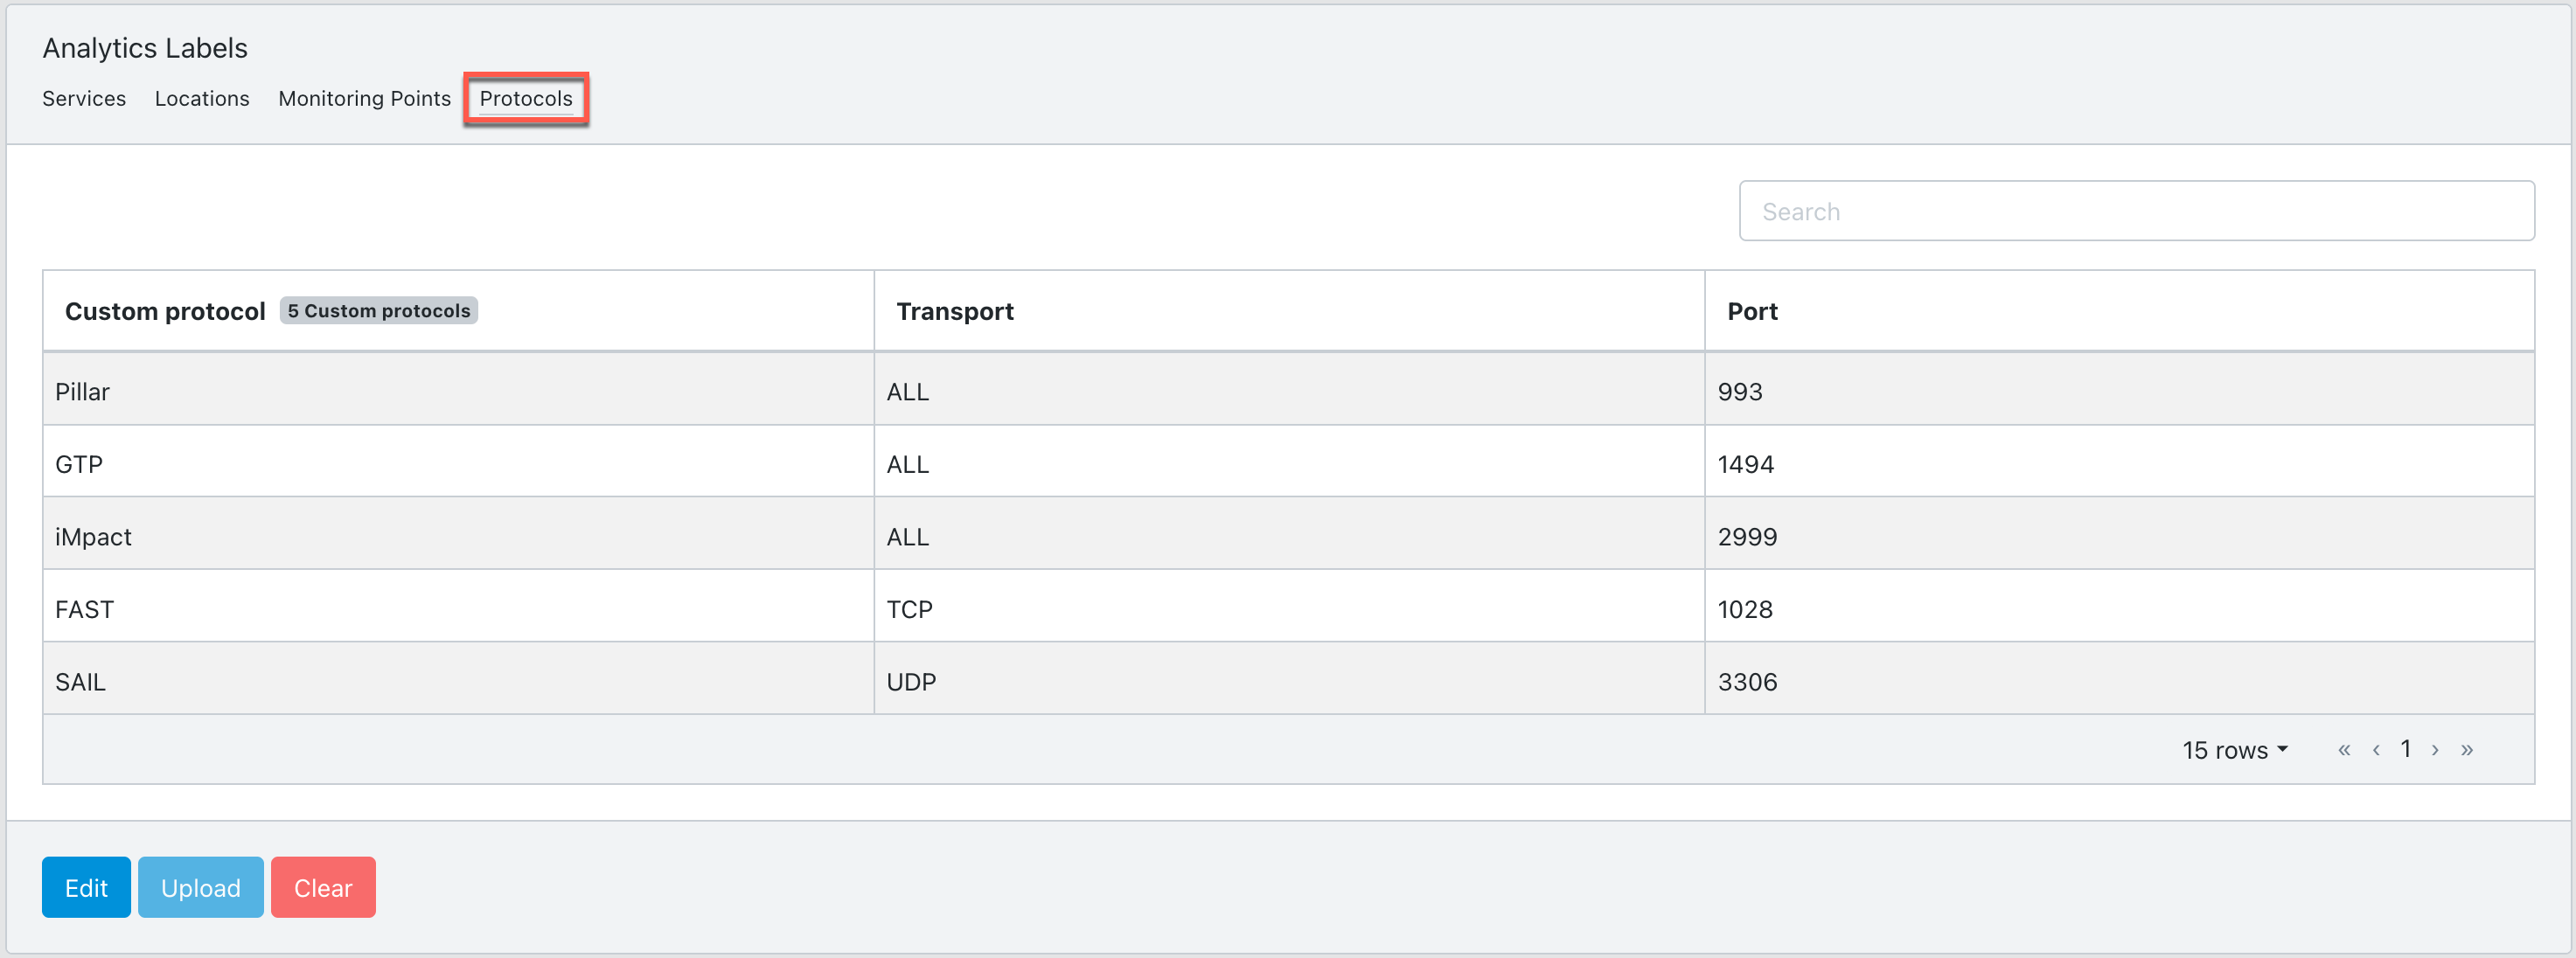
Click Edit to add, modify, or delete individual labels.
Use the search bar on the analytics labels panel to find the label you are looking for quickly.
Download an analytics label template
To download a sample CSV template or the current analytics label configuration, go to the Services, Locations, or Monitoring Points tab on the Analytics Label panel and click Download Template.
If the labels are not configured, the downloaded template will be a sample file that can be used as a reference for setting up your own configuration.
If the labels have been configured, the downloaded file will contain the existing label settings. This file can be uploaded to another cClear device to replicate the same configuration.
Note
Download is not available for configuring analytics labels using protocols.
Clear the analytics label configuration
To delete an analytics label configuration, go to the Services, Locations, Monitoring Points, or Protocols tab on the Analytics Labels panel and click Clear to remove the label configuration.