3. Observability home page
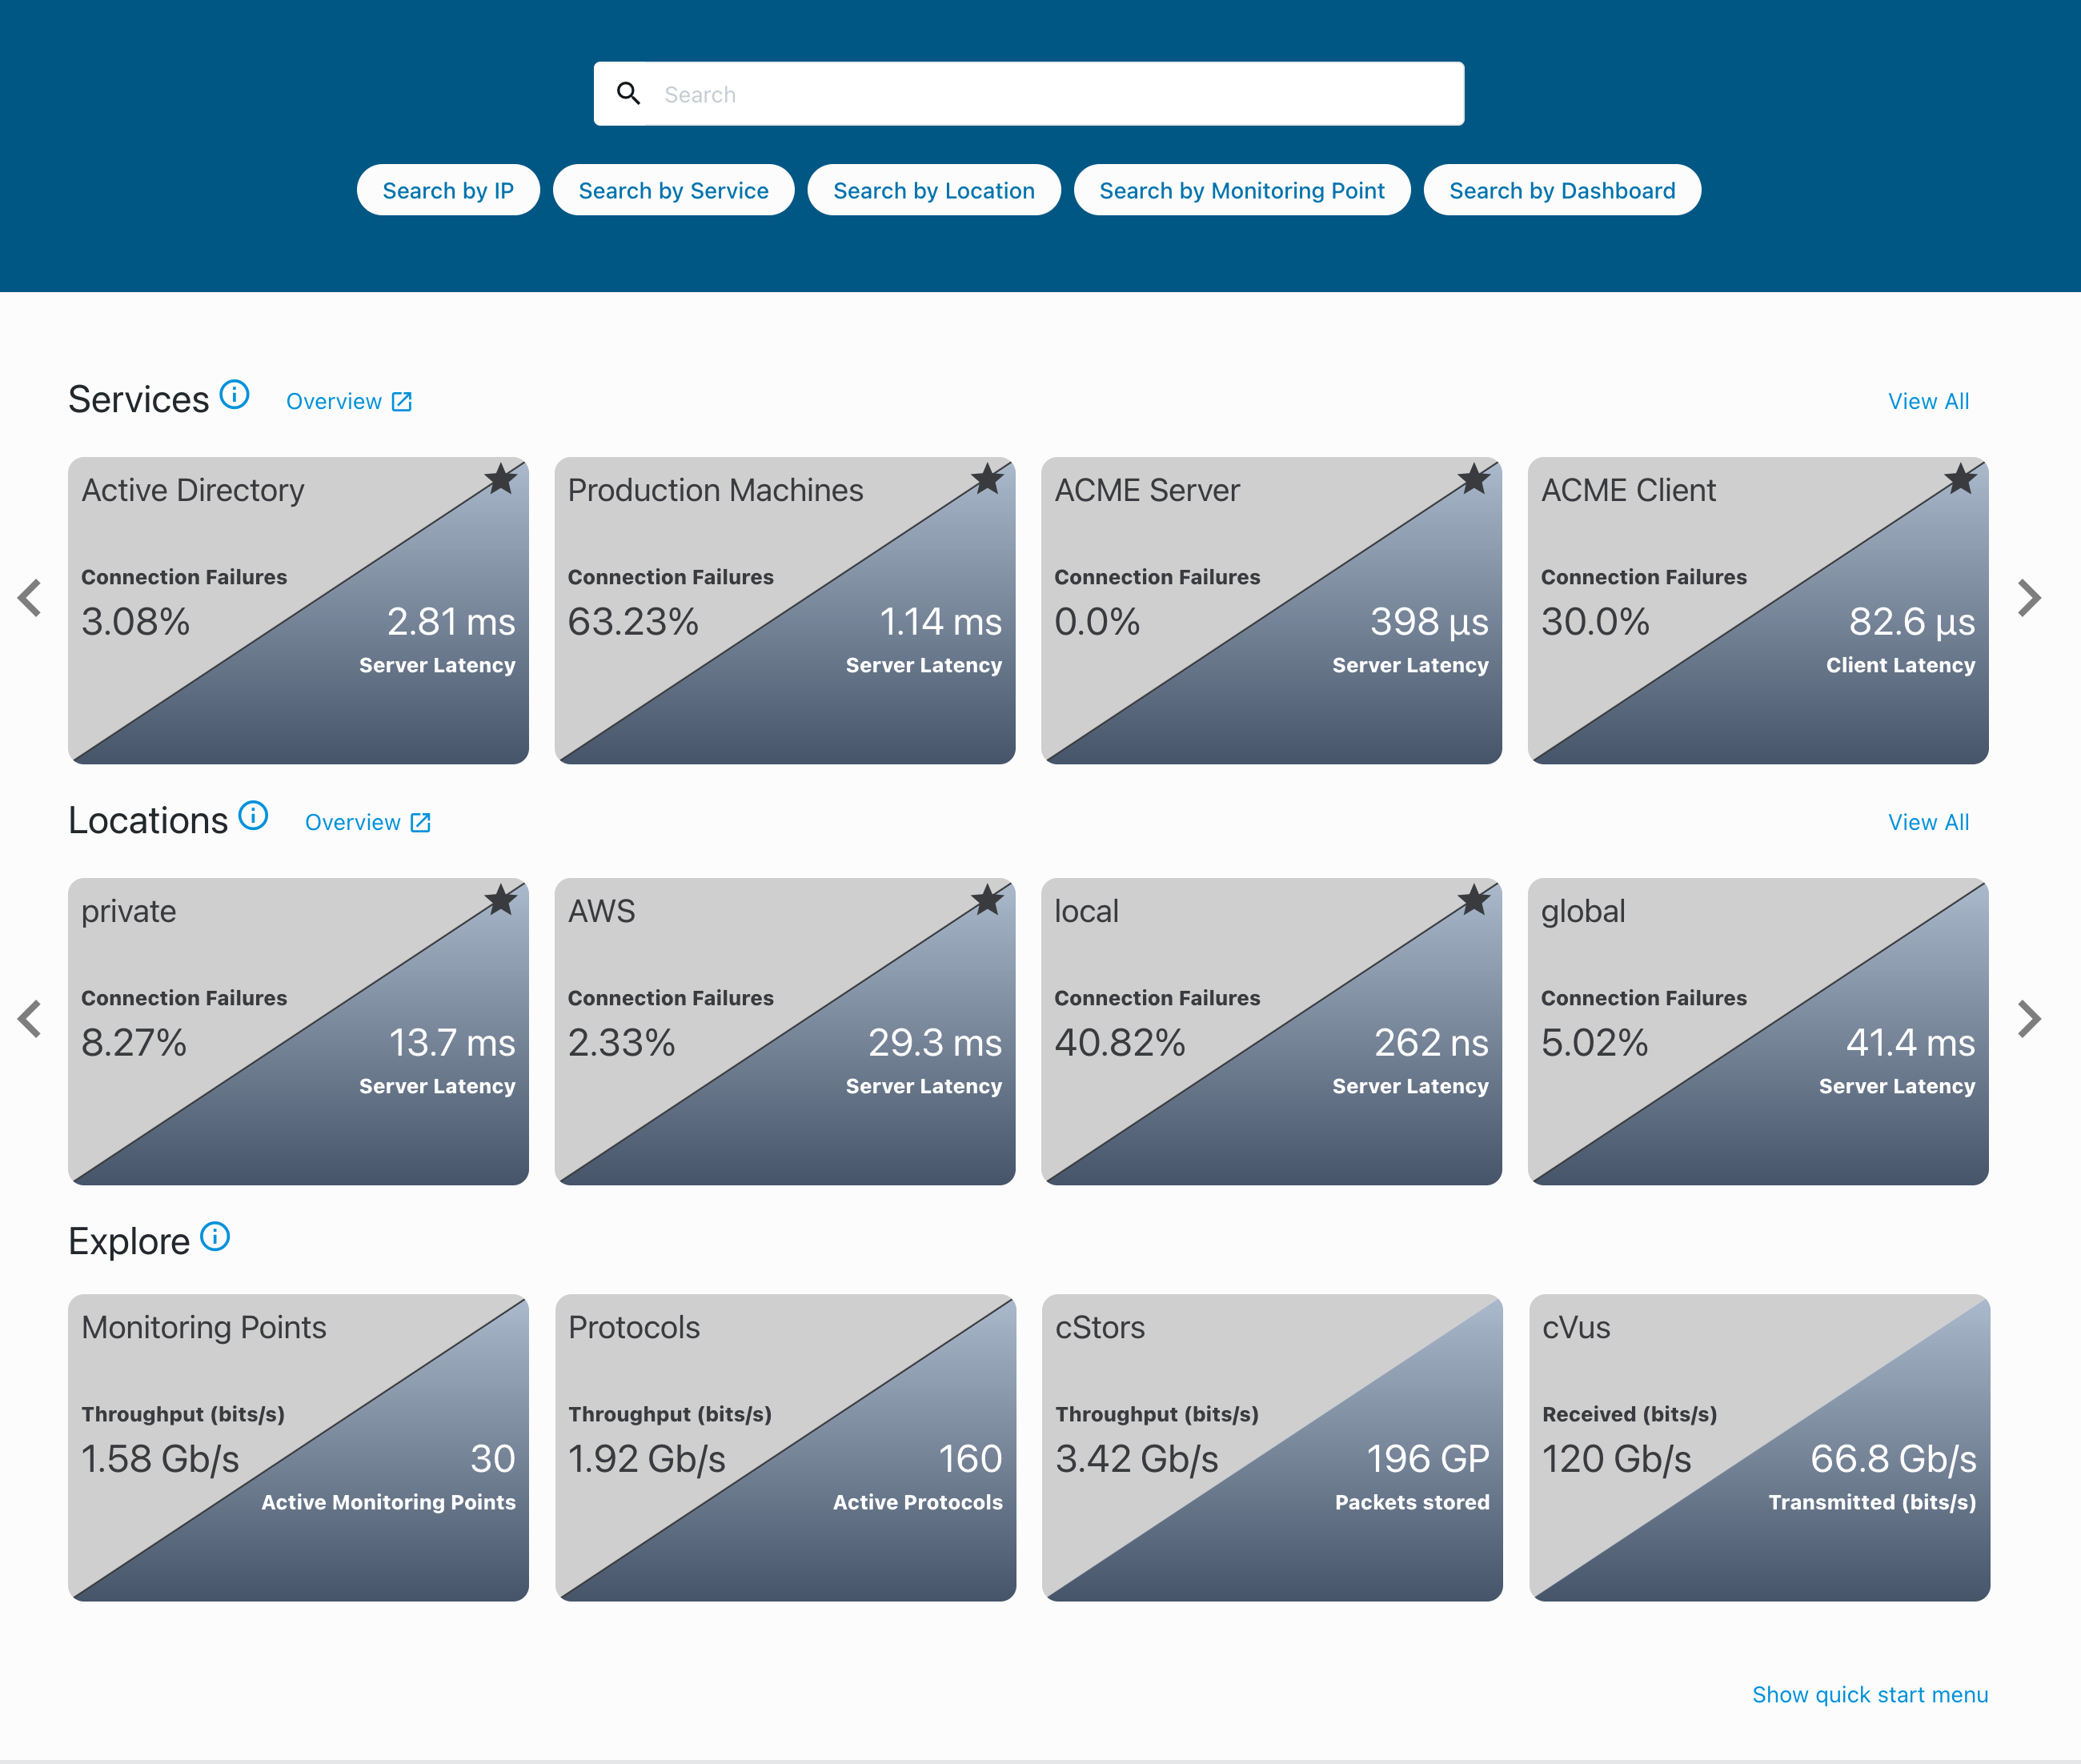
The Observability home page is a collection of metrics that allow you to monitor your network across various user-defined groups, such as services, locations, monitoring points, protocols, and devices. These metrics provide insights into your network's critical traffic, presenting key data and directly linking to dashboard workflows for in-depth analysis. To find out more about these workflows, see the Explore the workflows.
Each tile on this page corresponds to an analytics label or device you monitor in cClear. By default, the tiles display the top metrics based on the highest session activity recorded in the last 24 hours.
- Search field
Use the search field at the top of the page to find IP addresses, services, locations, monitoring points, and dashboards. Click a search prompt to auto-fill it into the search field and activate the search. Enter your search input after the prompt to display matching results. Click a result to open the related dashboard.
When you click the search field, your five most recent selections appear for quick access.
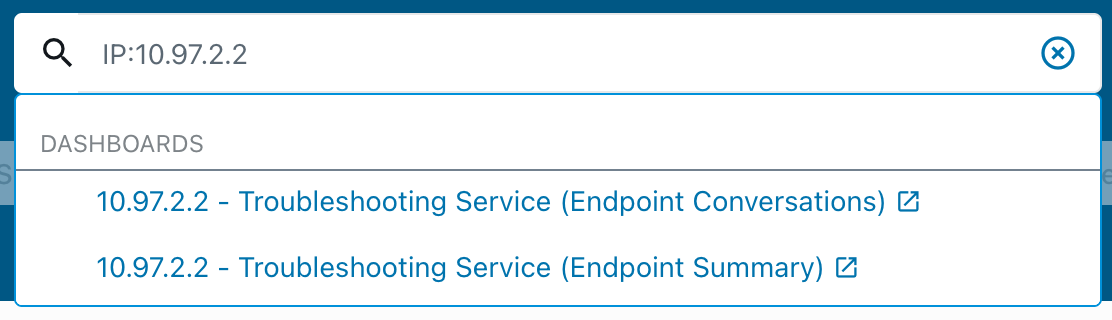
Enter a valid IP address to link to the related Level 3 troubleshooting endpoint summary or endpoint conversations dashboard. The link will direct you to the dashboard, with the IP address automatically populated as the endpoint.
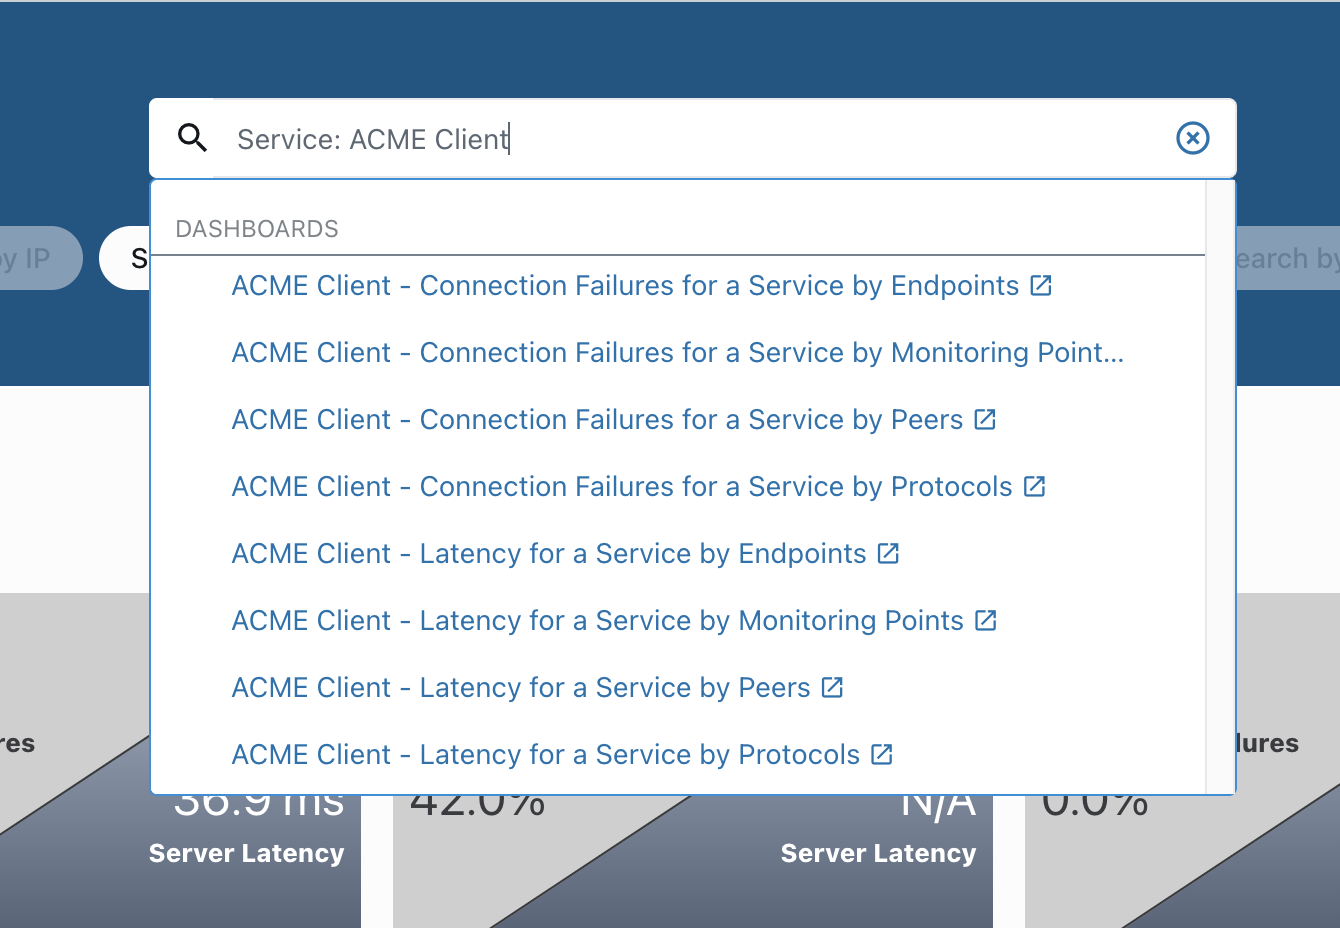
Enter a service, location, or monitoring point in the search bar to find links to related dashboards. The results include dashboards associated with the item you searched. Click a result to go directly to the corresponding Level 1 dashboard.
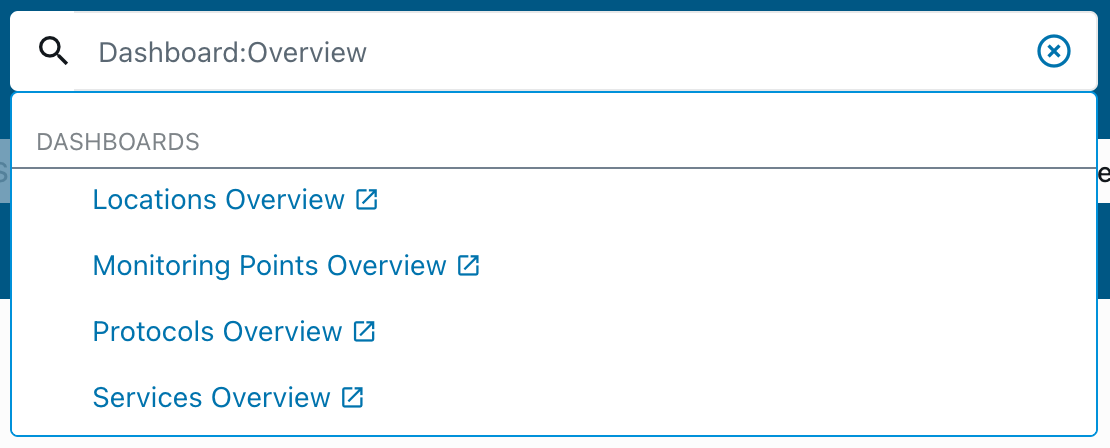
Dashboards in Grafana can be searched easily. Enter a term in the search field, and all matching folders and dashboards are displayed. Click on a result that will take you directly to that dashboard. The results are organized by folders and then by dashboards, sorted alphabetically, with favorites appearing first.
- Metrics
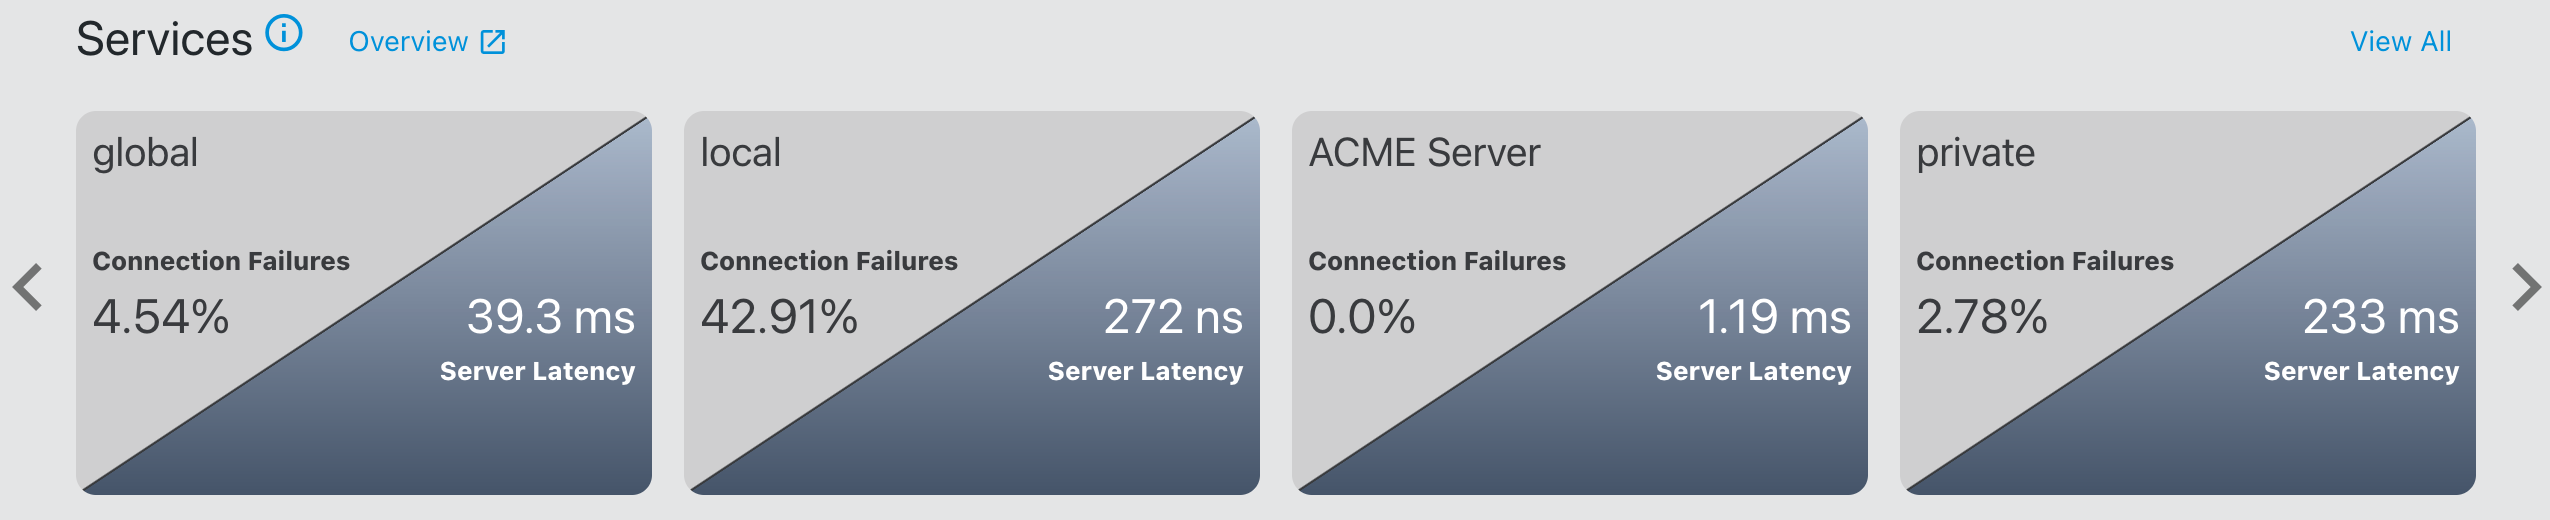
Each tile displays two metrics designed to provide insights into your network behavior. These metrics are averaged over a 24-hour period. By default, the tiles for Services and Locations display server latency and inbound connection failures. However, if this data is unavailable in the past 24 hours, the tile will instead show client latency and outbound connection failures. Click on either side of the tile to go to the associated level 1 dashboard in the Observability workflows.
The cStors tile displays port metrics for all connected cStor devices. Throughput is averaged over a 24-hour period. Total packets stored reflects the cumulative packet count across all cStors, based on their configured retention policies.
- Information icon

When hovering over the information icon, default metrics, definitions, and time period display in the tooltip.
- Overview links

There are two overview links available: Services Overview and Locations Overview. These links lead you to the Services and Locations Overview dashboards, where you can visualize and analyze real-time metrics and drill down for more detailed Latency or Connection Failure troubleshooting.
- View All
Click View All to display an alphabetical listing of all found services or locations. To revert back to the default view, which shows the top four most active sessions, click Collapse.
- Favorites

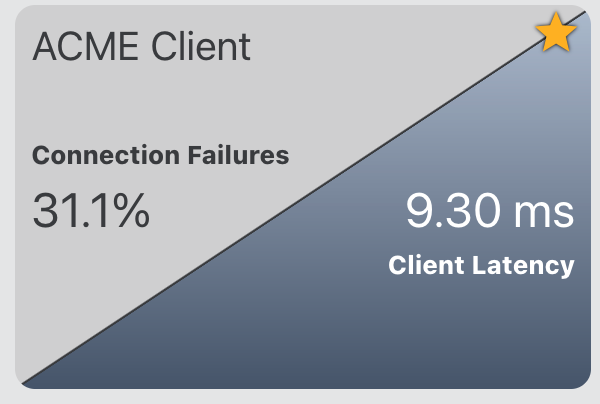
Mark a service or location as a favorite to have it listed first for quick and easy access.
Marking a favorite option for a specific service or location prioritizes it, ensuring it appears at the top of the displayed metrics. Active sessions are given secondary priority, meaning they are tracked and displayed after your selected favorites.
Selecting or removing a favorite is available only in the View All mode, which displays all services or locations sorted alphabetically.
On either the Services or Locations row, click View All.
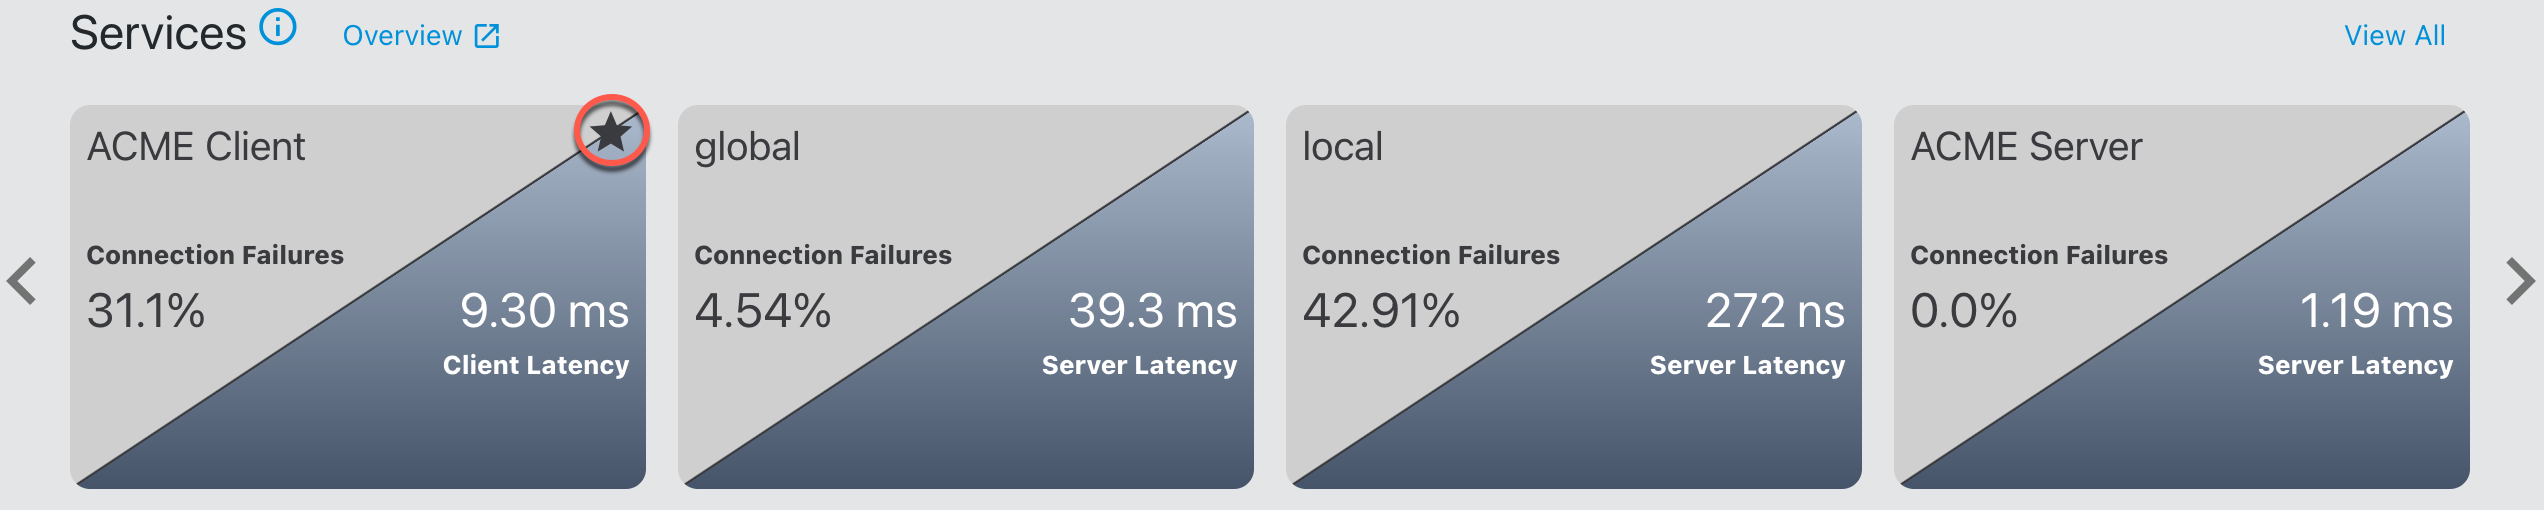
Select the star on one or more services or locations tiles to mark or remove as a favorite.
Click Collapse to revert the page to its default view with the top 4 metrics sorted by favorites and most active sessions.
Selected favorites are displayed and marked with a black star.
- Quick start menu
Start configuring your observability metrics to gain better visibility of your traffic at a glance. The Observability page contains a quick start menu with a list of tasks that must be completed to populate the tiles with your network metrics.
The quick start menu includes the following tasks, and a green checkmark
 will appear next to each task once it is completed.:
Go to Configure > cVus.
Click Add cVu.
To add a cVu with Auth Type: User Login follow step 3a. To add a cVu with Auth Type: OAuth follow step 3b.
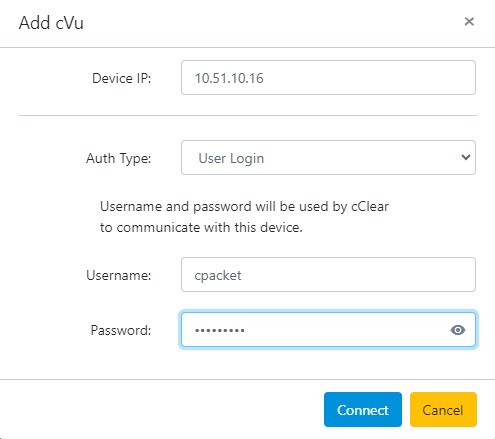
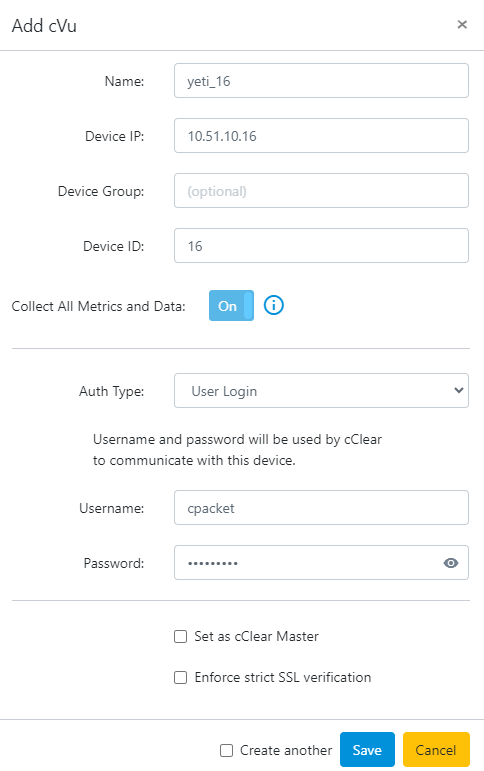
For Auth Type, select User Login.
Enter the cVu IP address and login credentials, then click Connect:
Enter the cVu name and device ID, then click Save:
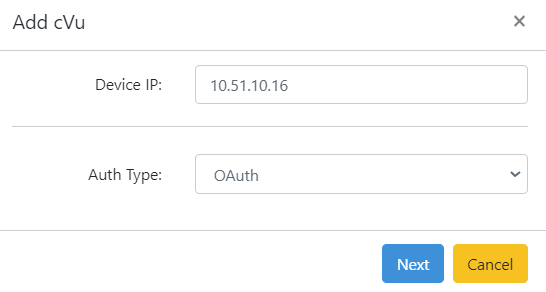
For Auth Type, select OAuth.
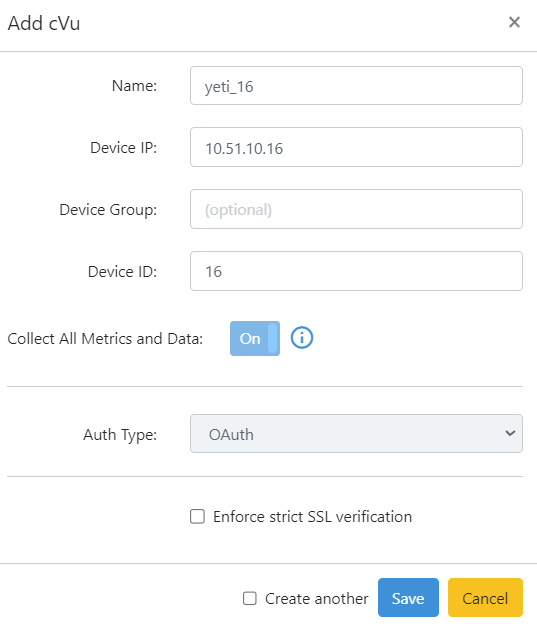
Enter the cVu IP address and click Next.
Enter the cVu name and device ID, then click Save.
Go to the cVu device Config/Status > User Mgmt > OAuth2 page to accept the access request. The request needs to be accepted by the cVu to connect with cClear. If the request is not accepted the cVu status will show as 'Not Connected'.
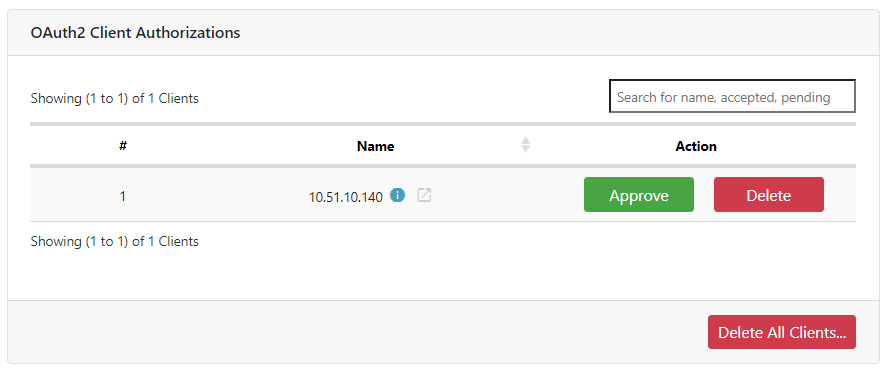
Verify the cClear connection has been approved and communication between cClear and cVu is established.
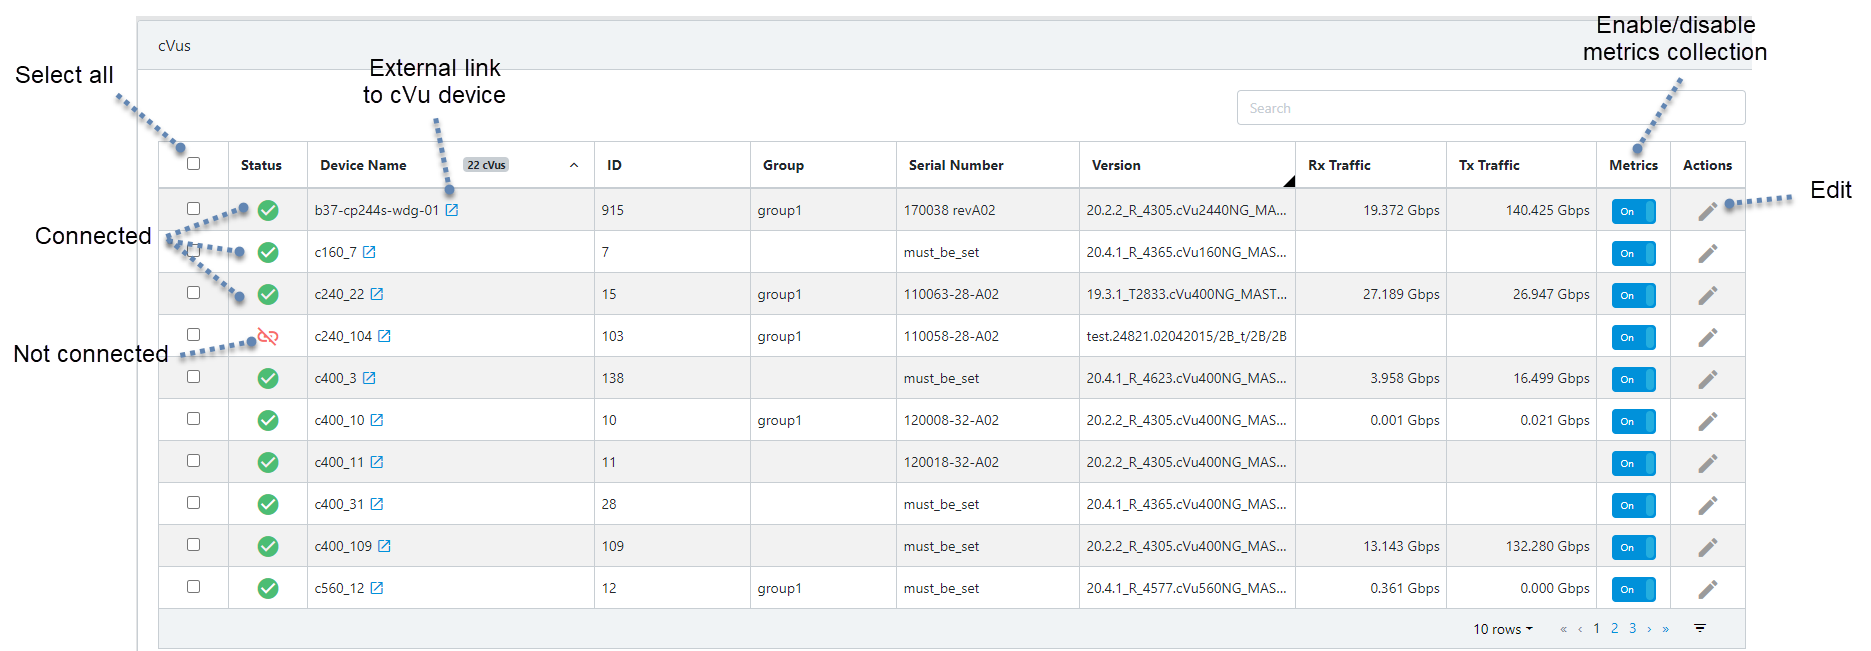
After successfully adding cVus, an overview of cVu devices connected to the cClear is displayed. Display of the serial number and version for the cPacket device indicates that the device has been added to the cClear configuration. An indicator gives the connection status of each cVu device. From this page, it is also possible to modify and remove cVu devices. Adding a new cVu device automatically configures cVu metadata push parameters to operate with cClear. These parameters include cClear device name, cClear hostname, and UDP push parameters.
By default, cClear continuously collects port counters from connected cVu devices. To disable automatic collection for a cVu, turn off the Metrics toggle.
Once devices are added, time synchronization status across devices is confirmed and can be managed by cClear.
Go to Configure > cStors.
Click Add cStor.
To add a cStor with Auth Type: User Login follow step 3a. To add a cStor with Auth Type: OAuth follow step 3b.
Note
cStor10 does not support OAuth.
For Auth Type, select User Login.
Enter the cStor name, IP address, and login credentials. Selecting an associated cVu and port is optional.
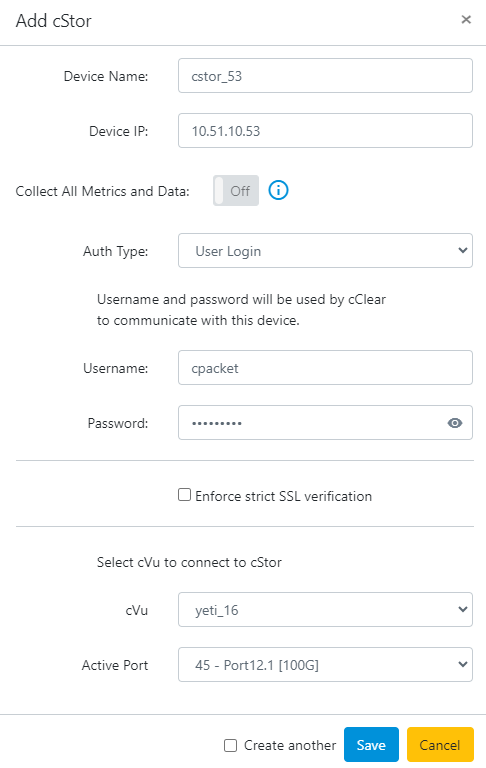
Click Save to add the cStor.
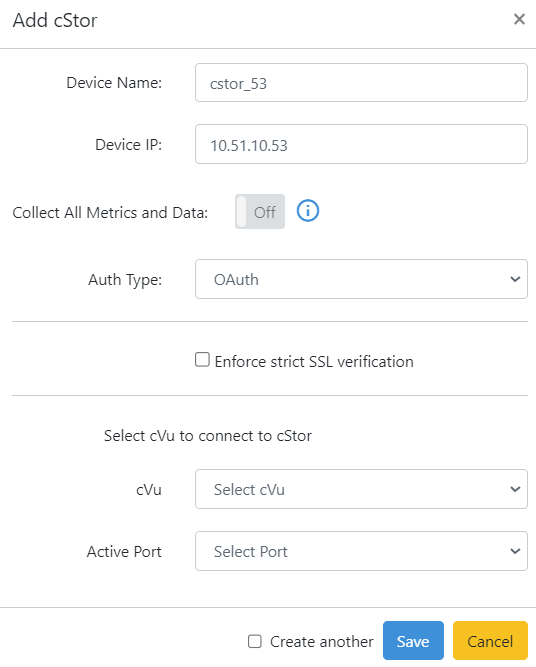
For Auth Type, select OAuth.
Enter the cStor name and IP address and click Save. Selecting an associated cVu and port is optional.
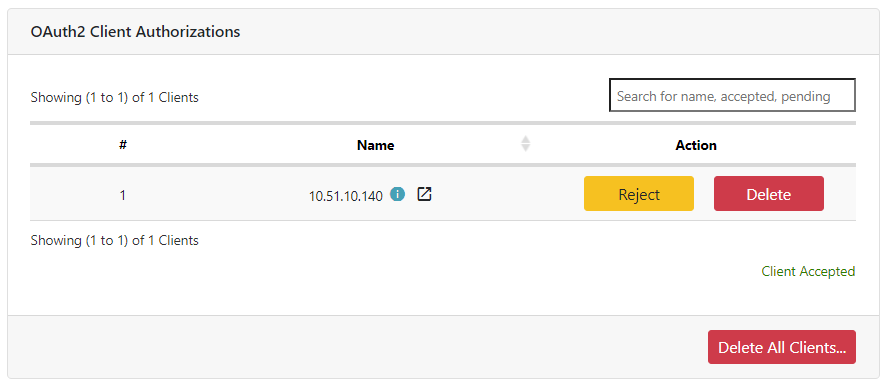
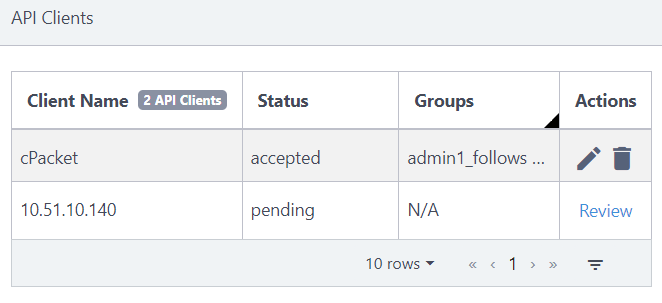
Go to Administration > Auth > API Clients on the cStor device to approve the request. Select Review for the cClear being added.
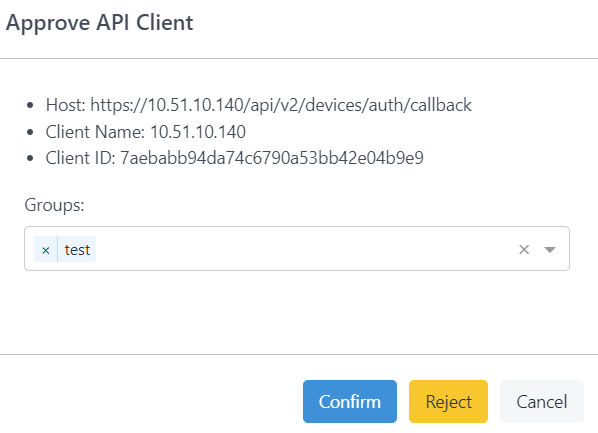
Select a group and click Confirm to approve the client.
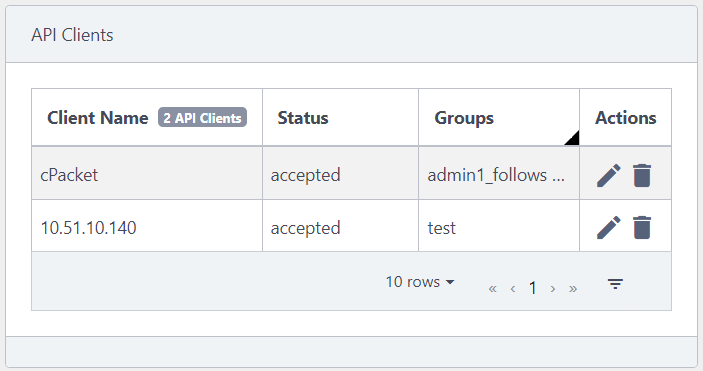
Verify the cClear connection has been approved. The status 'accepted' means communication between cClear and cStor is established.
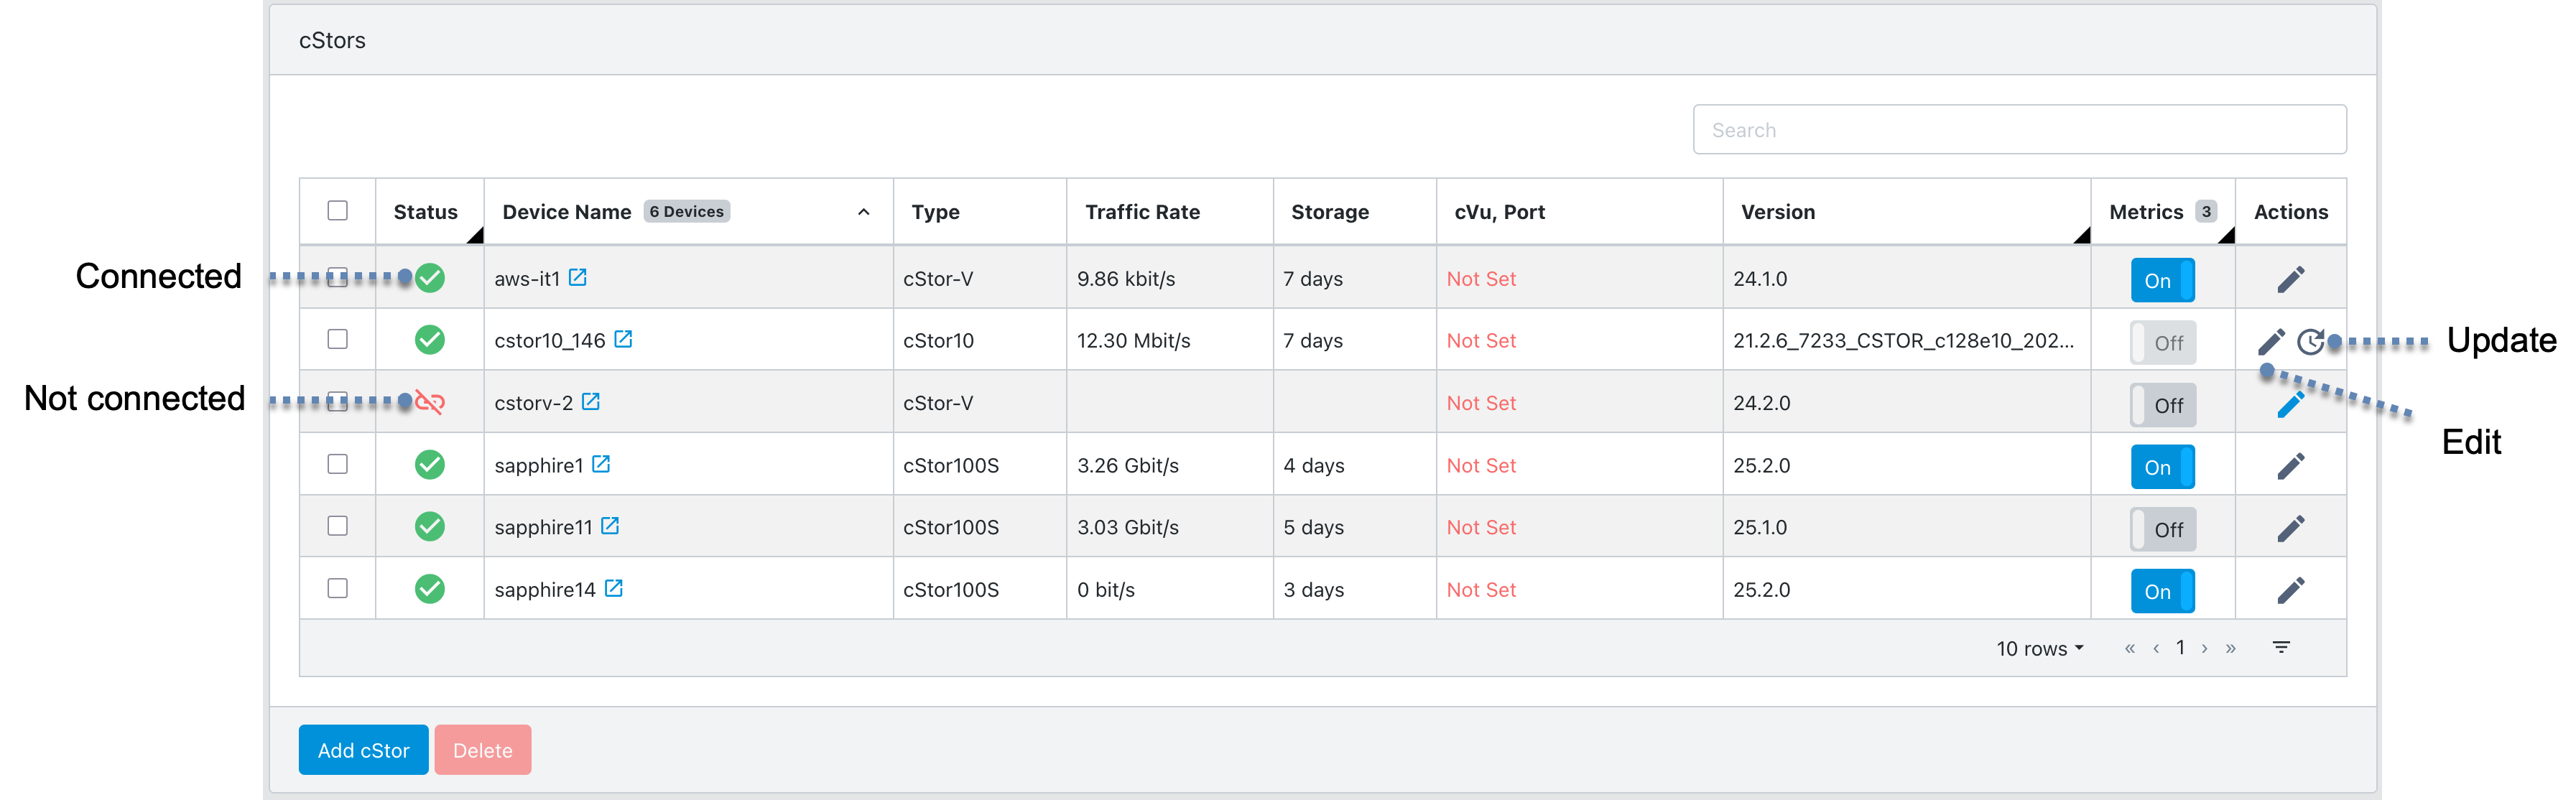
After adding cStors, an overview of cStor devices connected to the cClear is displayed. The overview includes the software version for the cStor, the traffic rate, and the storage time elapsed. From this page, it is also possible to update, modify, and remove cStor devices.
By default, port counter collection for cStor devices is disabled. To enable automatic collection for a cStor, turn on the Metrics toggle.
Important
Enabling or disabling cStor metrics does not impact analytics collection for the Network Monitors. See Section 5.9 "Metrics" in the cStor S User Guide for more information on cStor port counters.
Once devices are added, time synchronization status across devices is confirmed and can be managed by cClear.
Go to Configure > Network Monitors and click Add New.
Enter a meaningful monitor name and description (optional). Select the monitor type and CIDR using the IP/Prefix format. To collect all data from all source and destination IP addresses (and set the CIDR to 0.0.0.0/0), select the Collect all data check box.
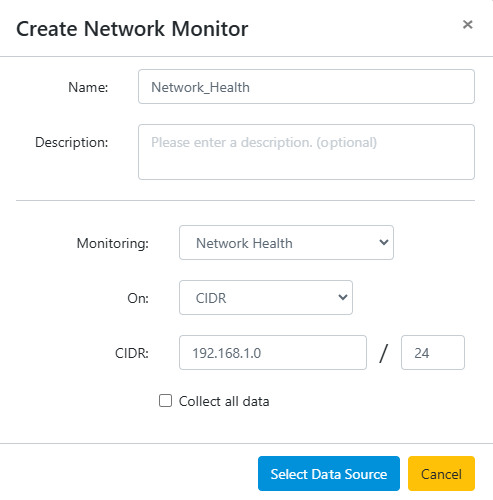
Click Select Data Source to continue.
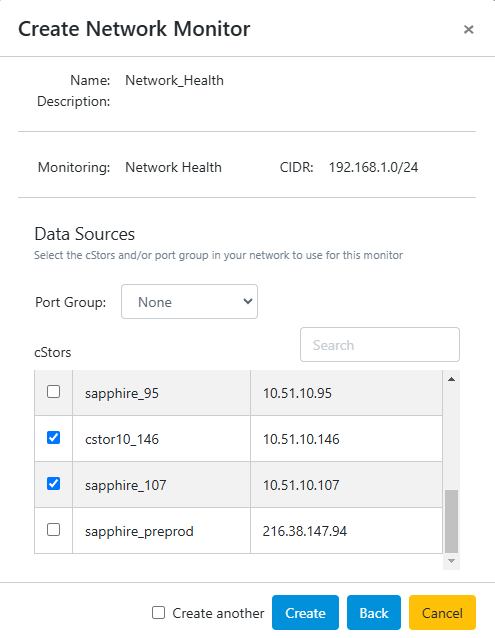
Select the cStor or Port Group to use for the monitor. Click Create to save the network monitor. To quickly add additional network monitors, select Create another before clicking Create.
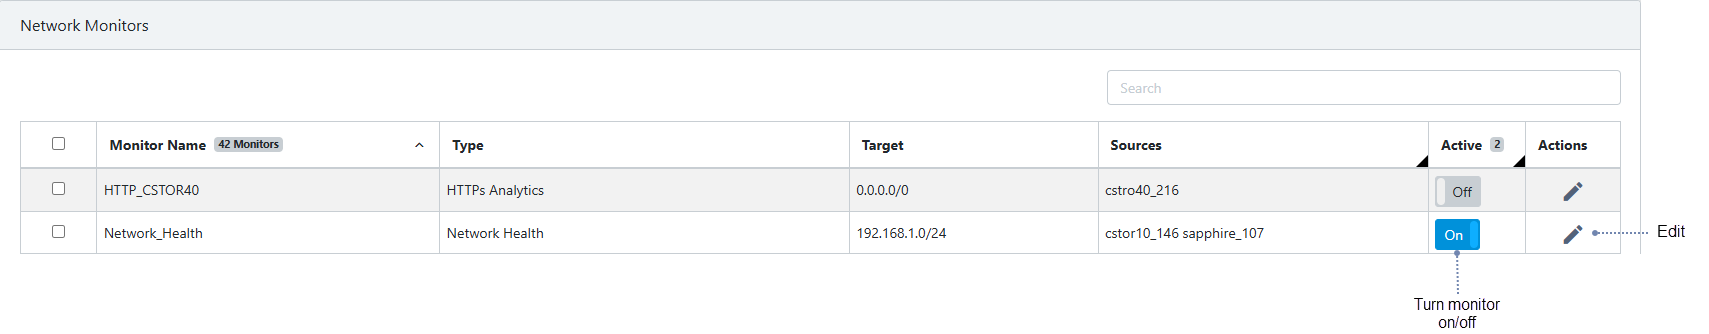
After saving, an overview of network monitors is displayed. From here, the monitors can be enabled, disabled, modified, or removed. Activating a network monitor is required for analytics to be collected. To enable a network monitor, turn on the Active toggle.
Use the following procedure to configure analytics labels using custom services. If services are undefined, they default to the following IP types: global, private, loopback, local, singletons, multicast, or broadcast. See Default IP types for default service name CIDR blocks.
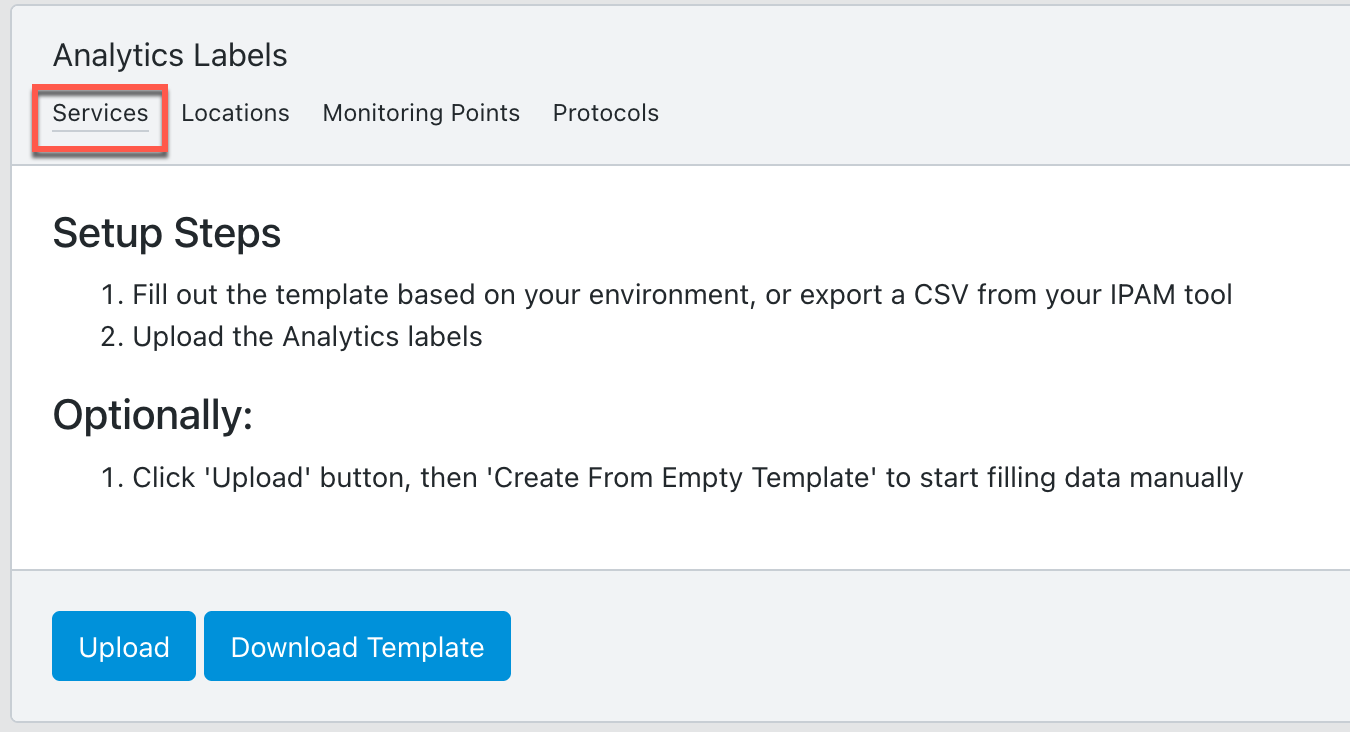
Go to Configure > Network Monitors > Analytics Labels and select the Services tab.
The initial configuration is input by uploading a CSV file. This file can either be from another cClear device or exported from your IPAM tool. For more information, see Download an analytics label template.
The CSV file needs to contain the following information:
Setting
Value
Service Name
Enter a service name.
IP/CIDR
Enter the comma-separated IP address, CIDR block, or IP range for your service. Use IPv4 format and hyphen separate ranges. For example: 20.70.80.0/24, 10.70.80.20-10.70.80.50.
IP addresses cannot overlap. Each subset must be fully contained and fall within the defined IP range.
Port
Optional: Enter the comma-separated port or port range for your service. Port ranges should be hyphen separated. For example: 2598, 1500-1590.
Protocol
Select All, TCP, or UDP from the drop-down menu. TCP is the default value.
Exclude
Select Yes or No from the drop-down menu. No is the default value. When exclude is set to Yes, the IP address, CIDR block, or IP range is omitted from the dashboard metrics.
If you don't have a CSV file with your configuration, use the following sample file or Download an analytics label template from your cClear. Edit the information in the sample file based on your environment. Note the spacing necessary for the IP/CIDR formatting:
Service Name,IP / CIDR,Port,Protocol,Exclude
ACME Server,10.197.2.2/24,,ALL,FALSE
ACME Client,10.197.1.2/24,,ALL,FALSE
Exchange,"10.70.80.10, 10.70.80.20-10.70.80.50, 20.70.80.0/24","993, 995",TCP,FALSE
VOIP,30.70.80.0/24,"993, 995",UDP,FALSE
LDAP,40.70.80.20-40.70.90.20,3306,TCP,FALSE
Splunk,"50.70.80.10, 50.70.80.15","1494, 2598",TCP,FALSE
Payment Processing,60.70.80.10,1500-1590,ALL,FALSE
Click Upload > Choose File to upload the CSV configuration file.
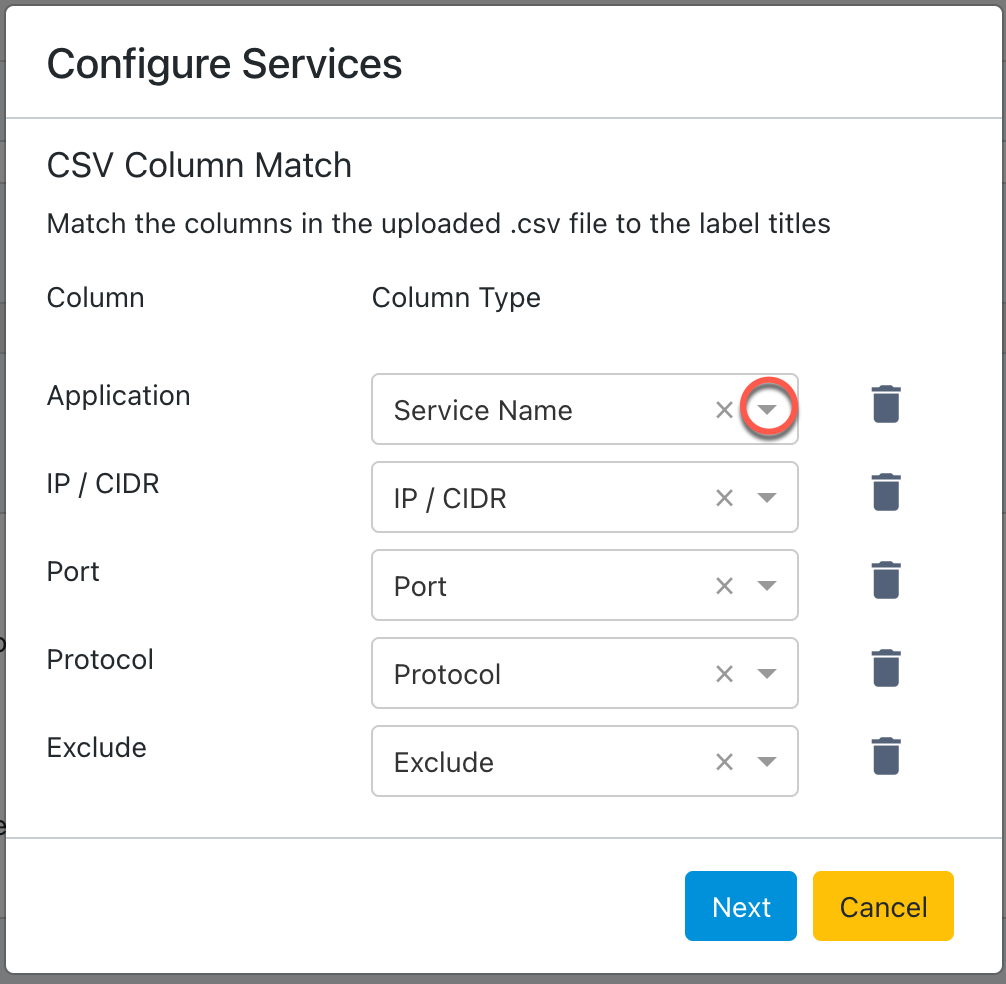
Use the drop-down in each Column Type field to match the label settings to the columns in the uploaded CSV file, and then click Next.
Edit any of the information in the table to adjust your labels. To add an additional label, click Add Row. To remove a label, click delete
 in the Actions column.
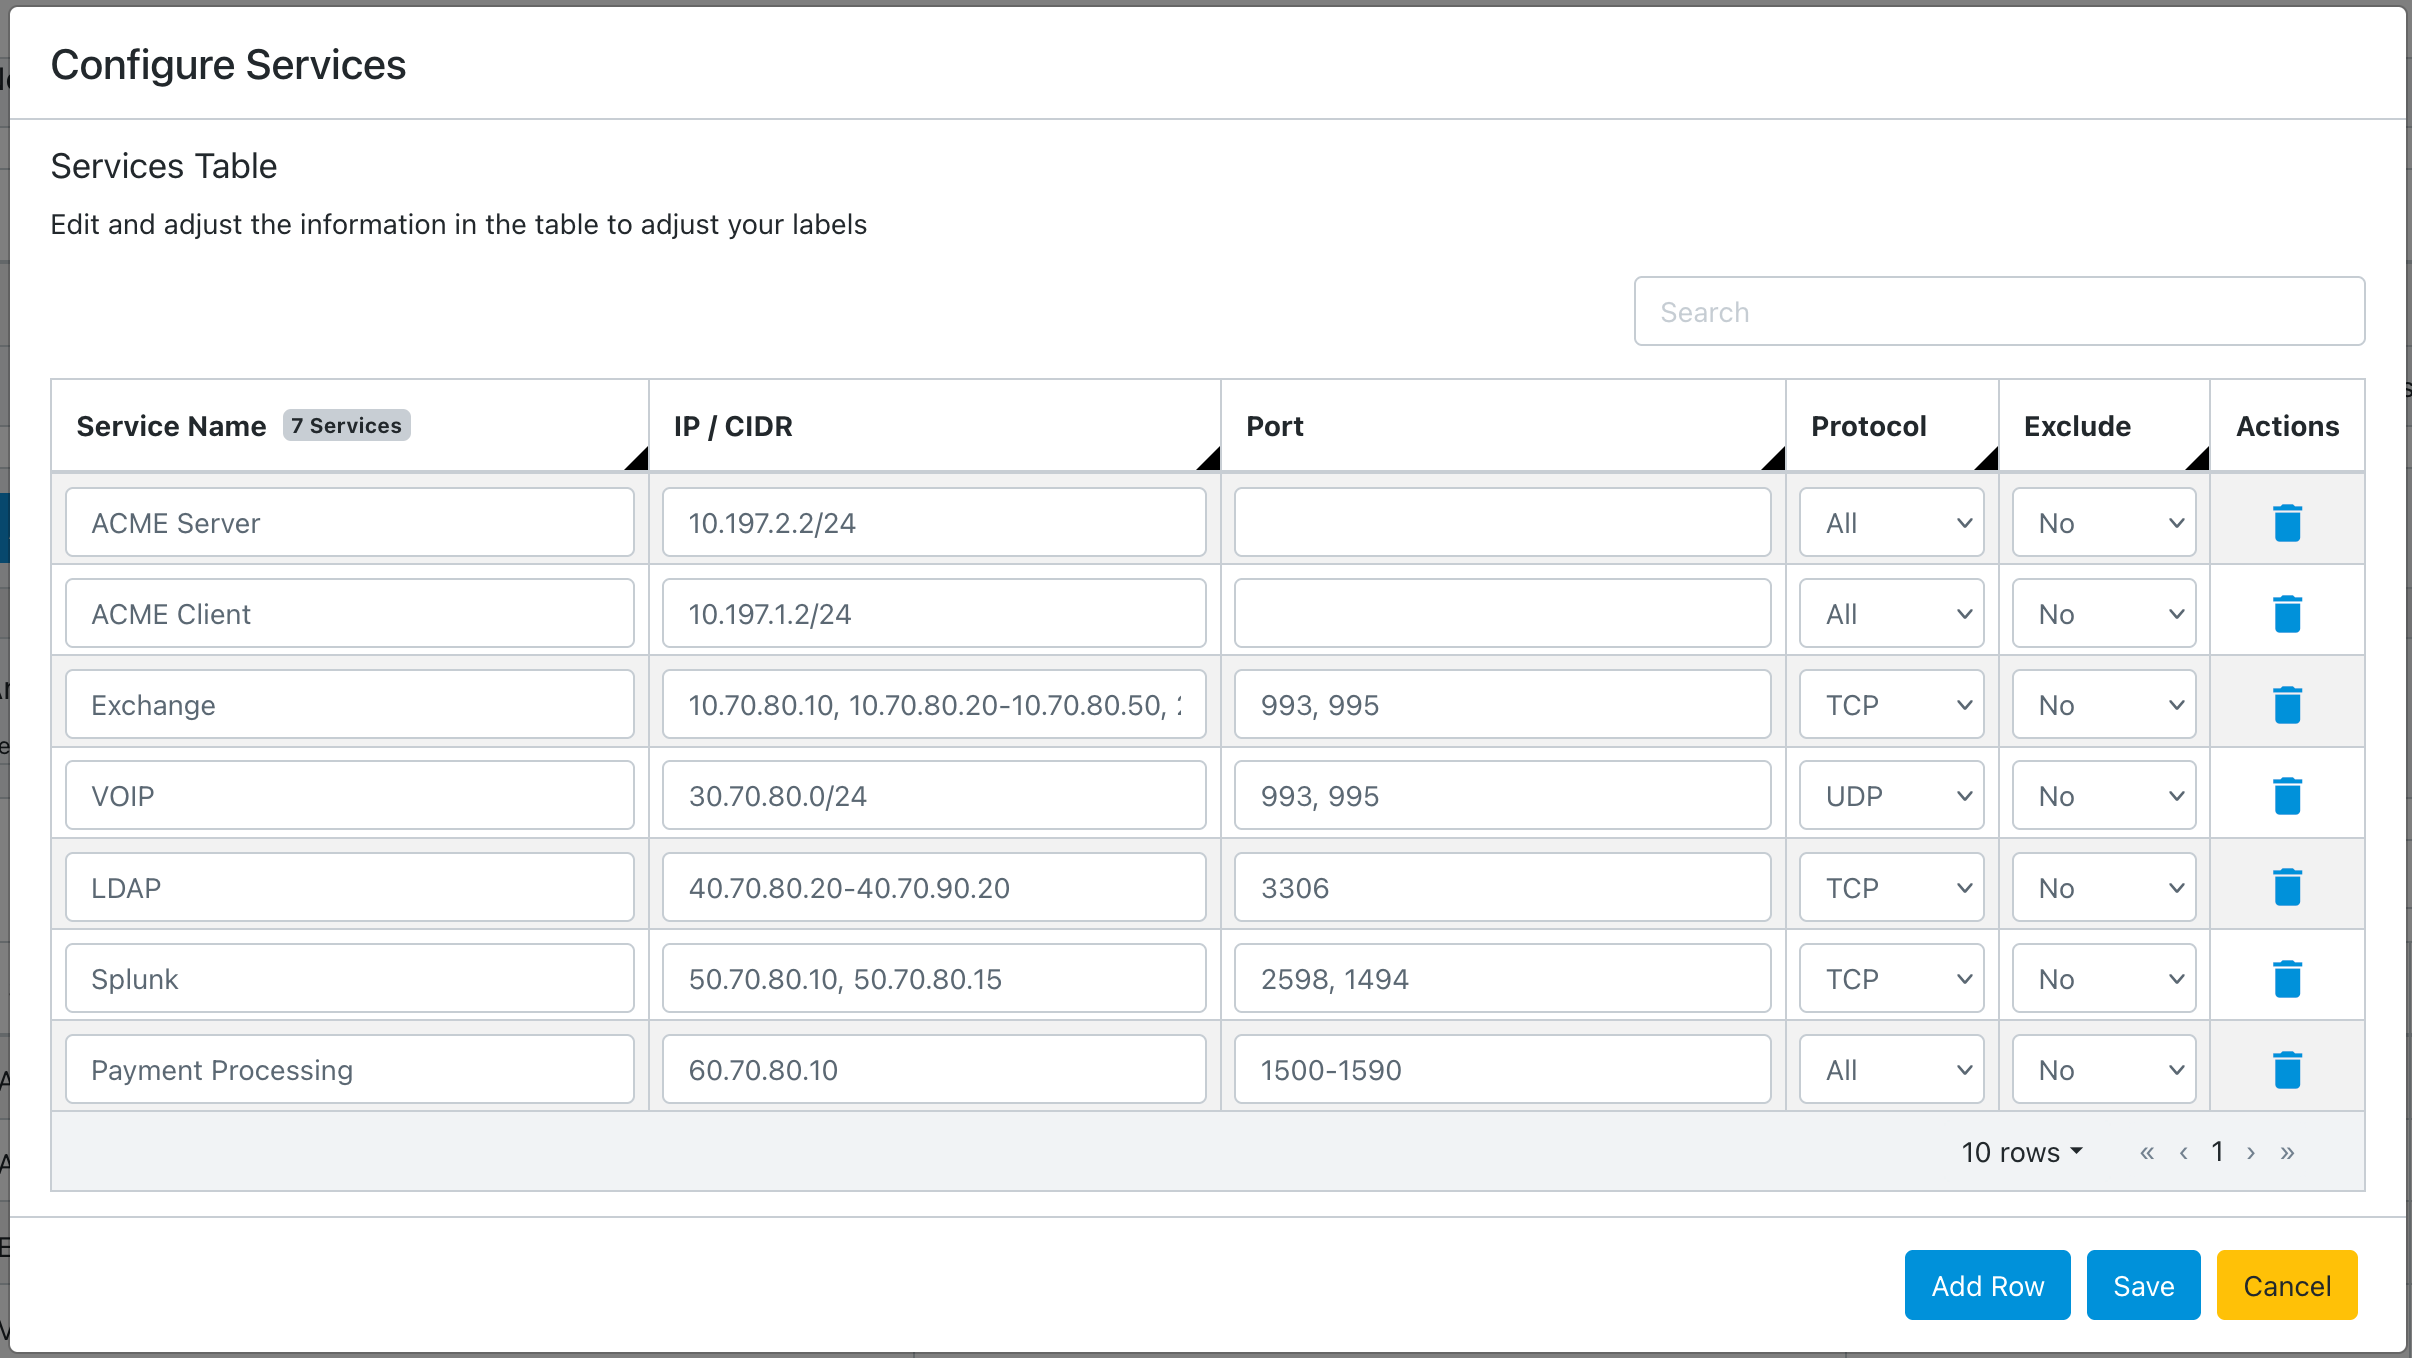
When you finish editing, click Save.
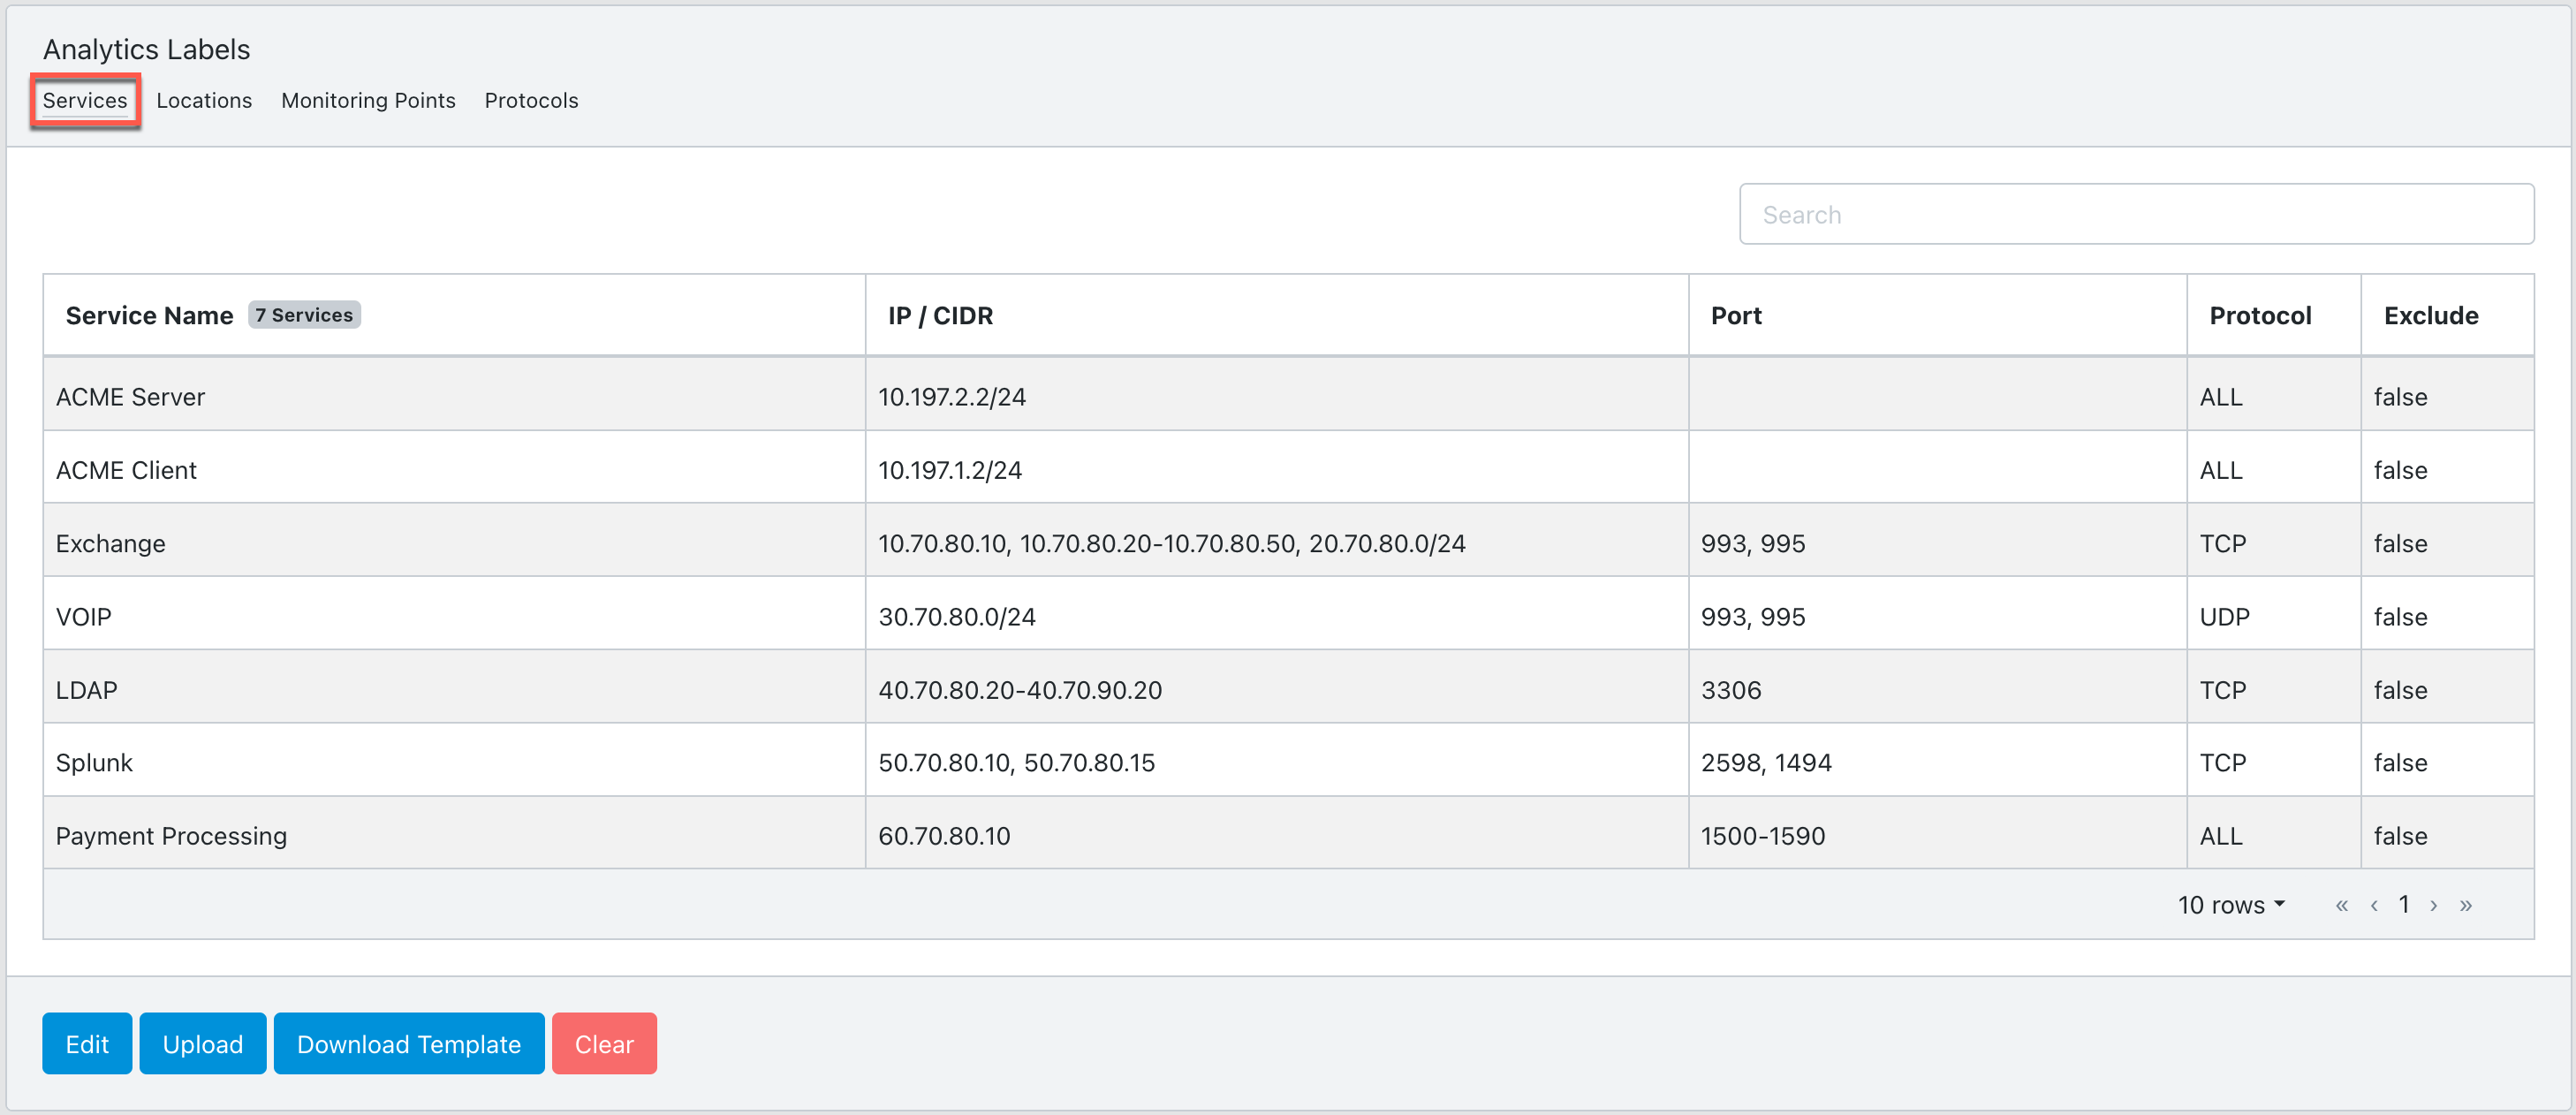
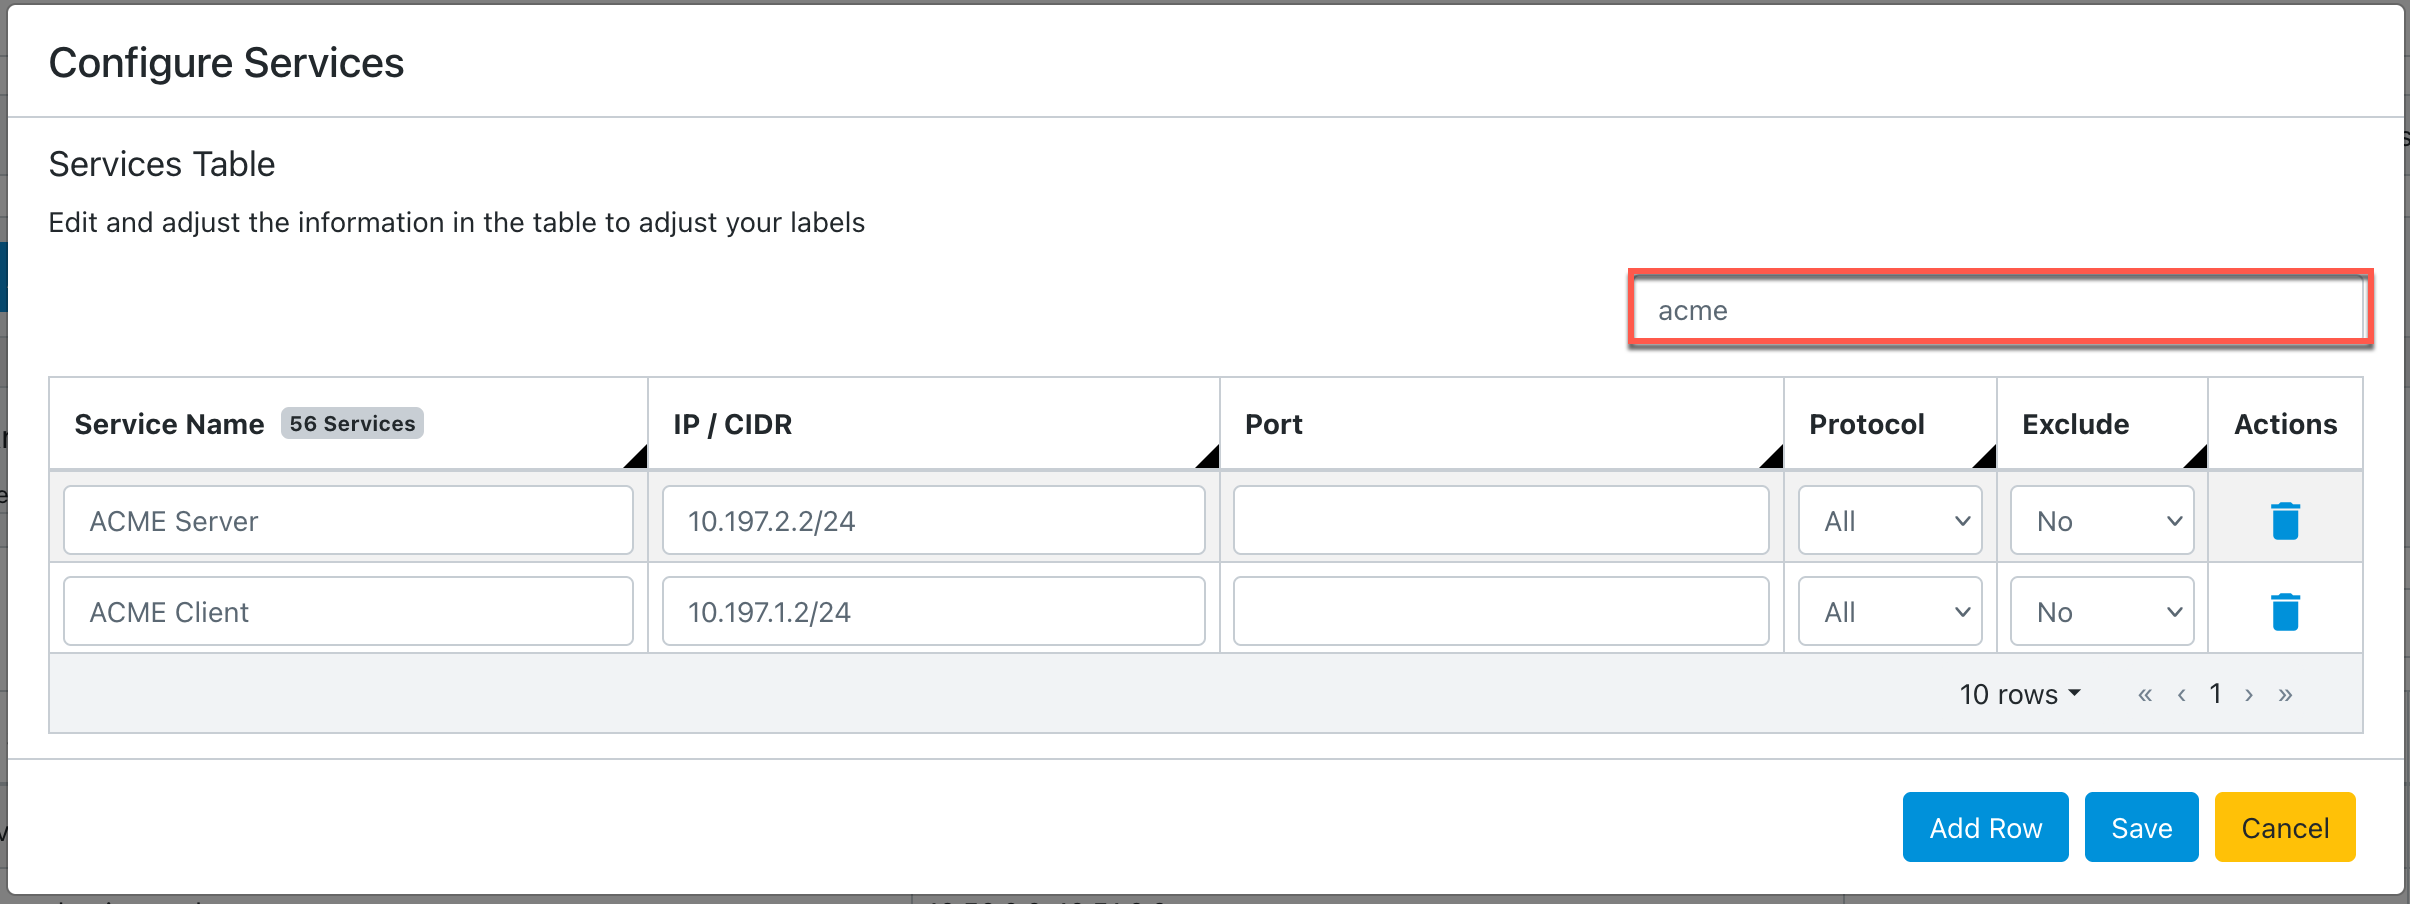
Configured services are displayed.
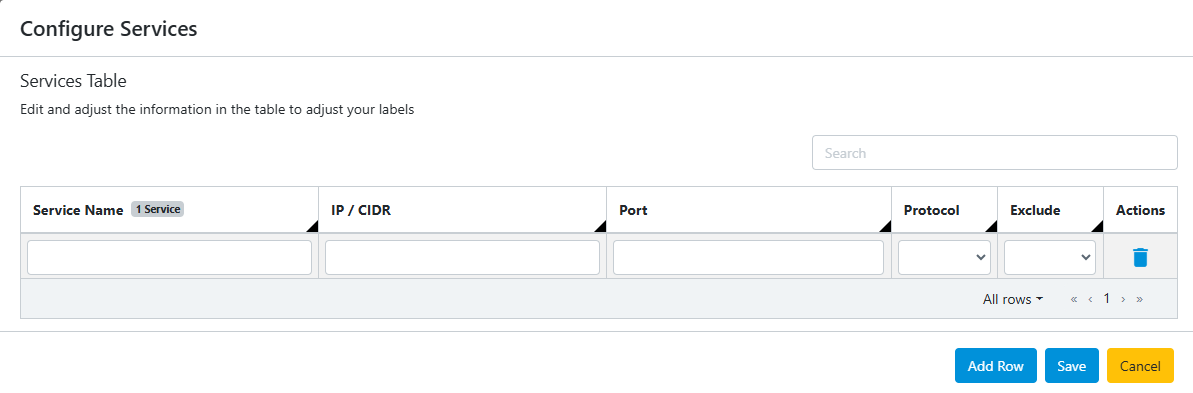
Alternatively, you can enter the label configuration manually using the cClear UI. Click Upload > Create From Empty Template. Enter the values from the table in Step 2 and click Save.
Click Edit to add, modify, or delete individual labels.
Use the search bar on the Services Table to find the label you are looking for quickly.
Use the following procedure to configure analytics labels using custom locations. If locations are undefined, they default to the following IP types: global, private, loopback, local, singletons, multicast, or broadcast. See Default IP types for default location name CIDR blocks.
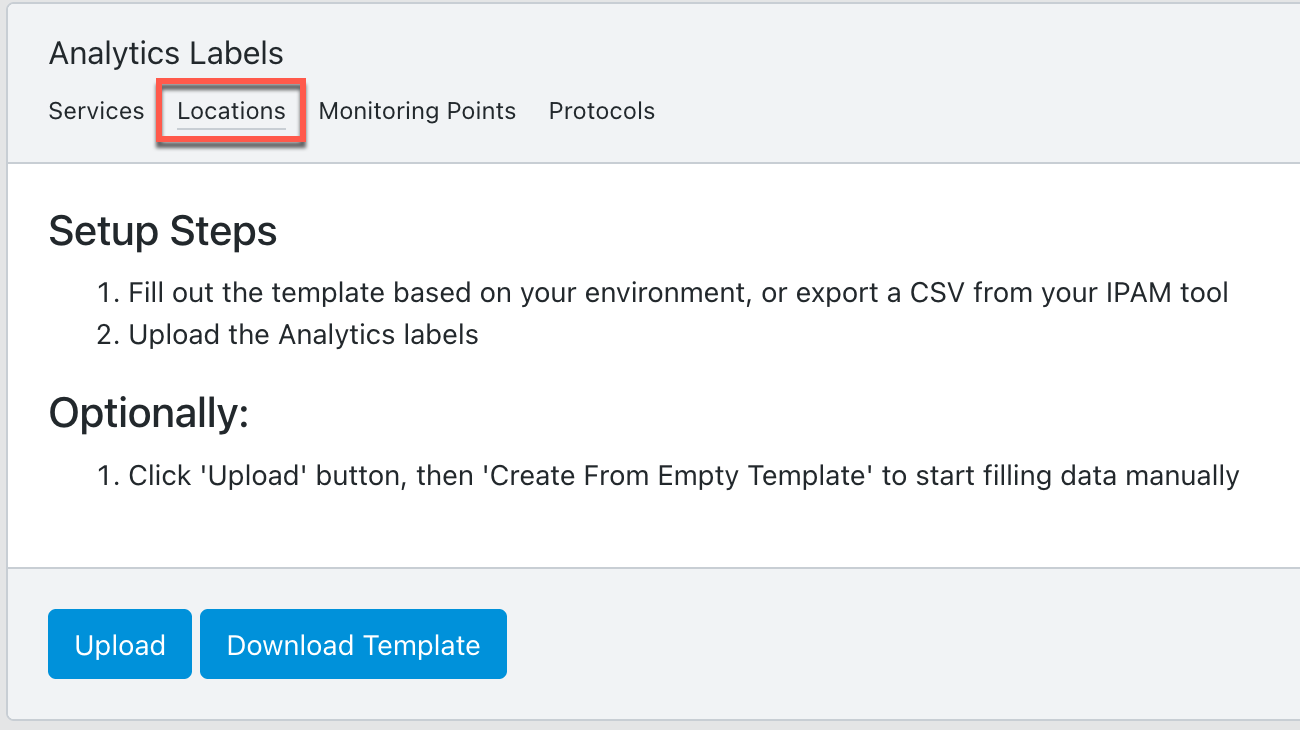
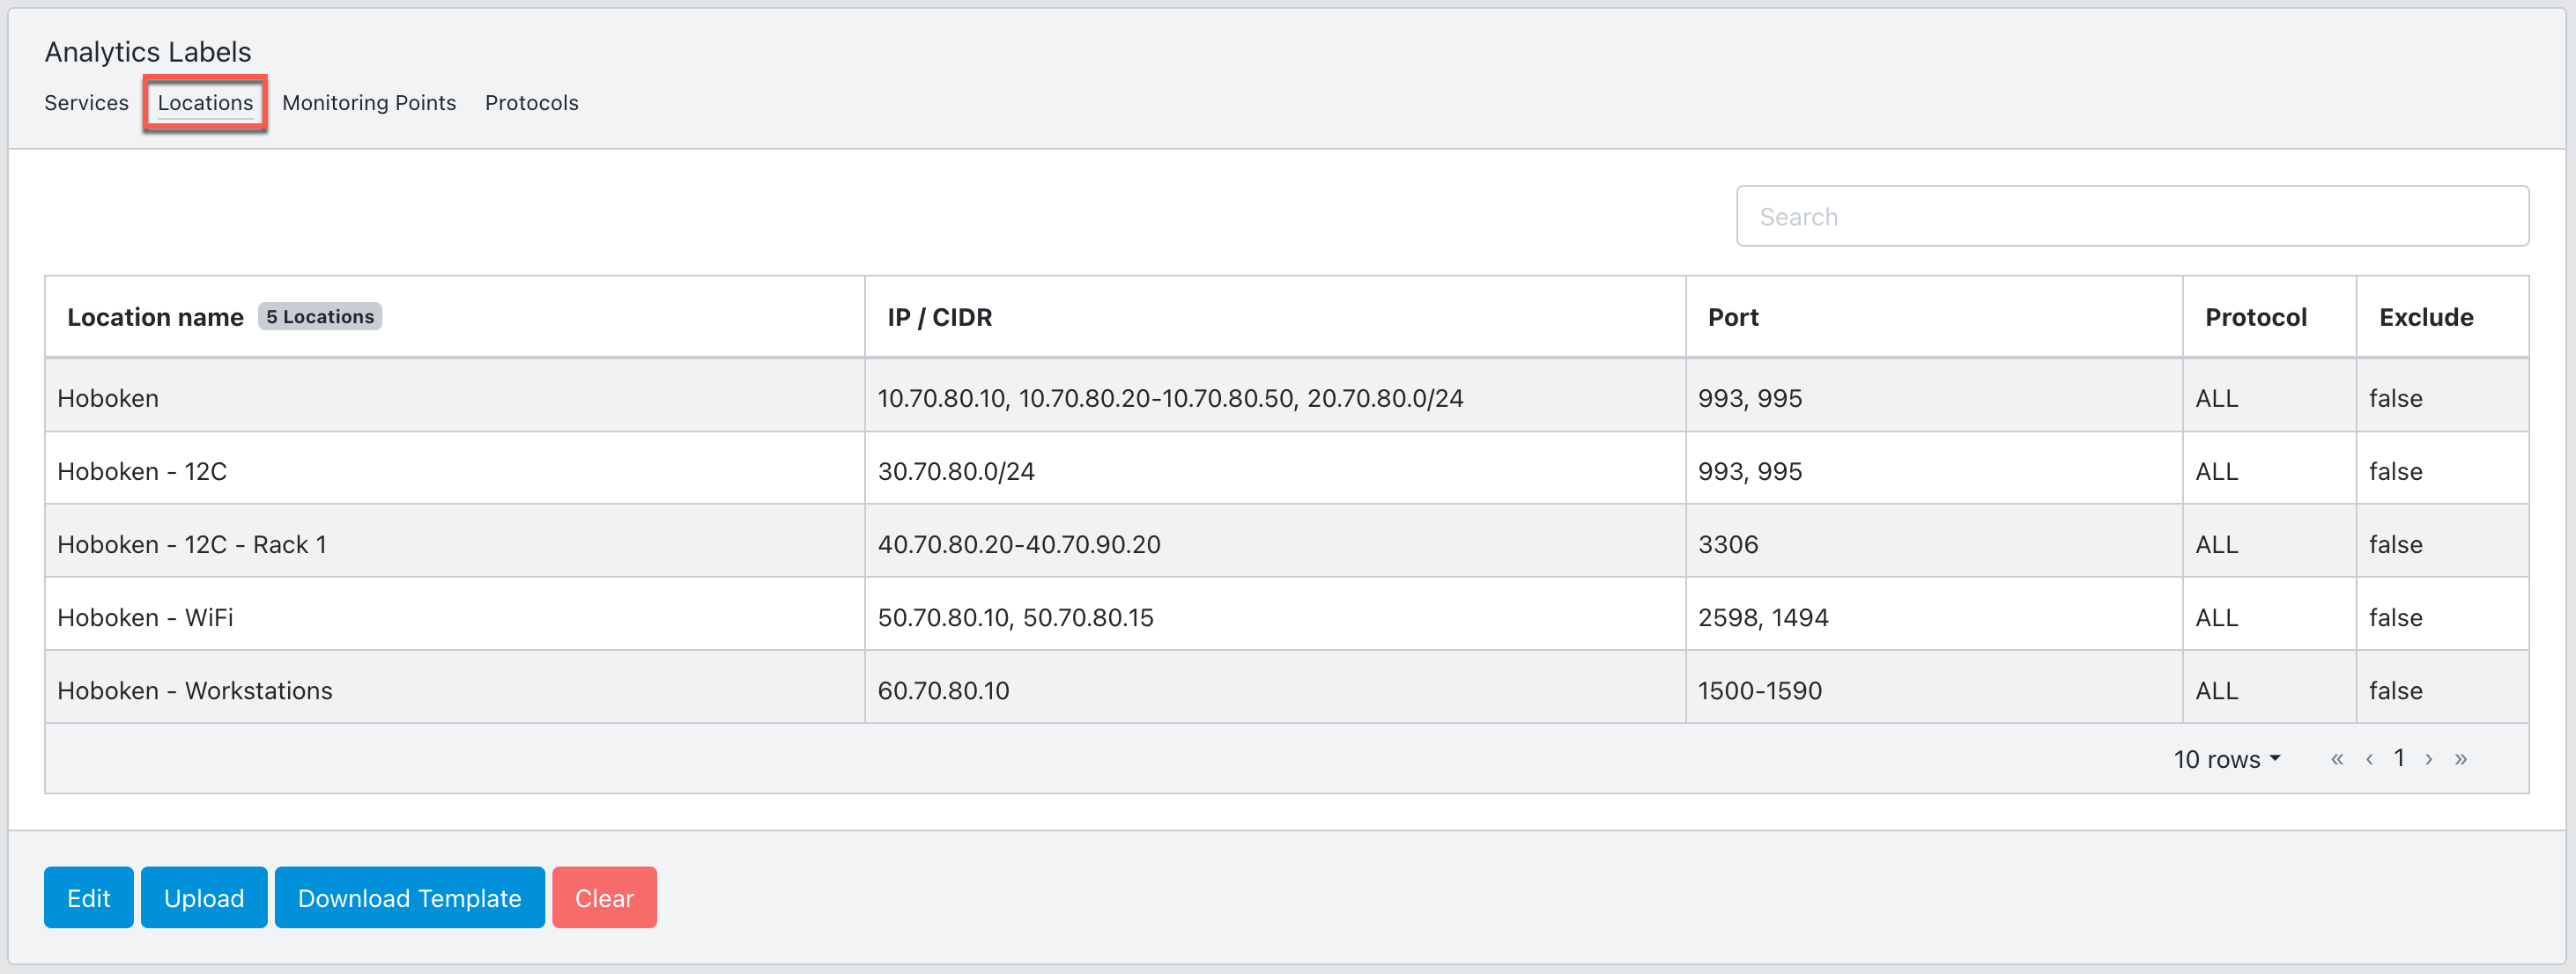
Go to Configure > Network Monitors > Analytics Labels and select the Locations tab.
The initial configuration is input by uploading a CSV file. This file can either be from another cClear device or exported from your IPAM tool. For more information, see Download an analytics label template.
The CSV file needs to contain the following information:
Setting
Value
Location Name
Enter a new location name.
IP/CIDR
Enter the comma-separated IP address, CIDR block, or IP range for your location. Use IPv4 format and hyphen separate ranges. For example: 20.70.80.0/24, 10.70.80.20-10.70.80.50.
IP addresses cannot overlap. Each subset must be fully contained and fall within the defined IP range.
Port
Optional: Enter the comma-separated port or port range for your location. Port ranges should be hyphen separated. For example: 2598, 1500-1590.
Protocol
Select All, TCP, or UDP from the drop-down menu. TCP is the default value.
Exclude
Select Yes or No from the drop-down menu. No is the default value. When exclude is set to Yes, the IP address, CIDR block, or IP range is omitted from the dashboard metrics.
If you don't have a CSV file with your configuration, use the following sample file or Download an analytics label template from your cClear. Edit the information in the sample file based on your environment. Note the spacing necessary for the IP/CIDR formatting:
Location name,IP / CIDR,Port,Protocol,Exclude
Hoboken,"10.70.80.10, 10.70.80.20-10.70.80.50, 20.70.80.0/24","993, 995",ALL,FALSE
Hoboken - 12C,30.70.80.0/24,"993, 995",ALL,FALSE
Hoboken - 12C - Rack 1,40.70.80.20-40.70.90.20,3306,ALL,FALSE
Hoboken - WiFi,"50.70.80.10, 50.70.80.15","1494, 2598",ALL,FALSE
Hoboken - Workstations,60.70.80.10,1500-1590,ALL,FALSE
Click Upload > Choose File to upload the CSV configuration file:
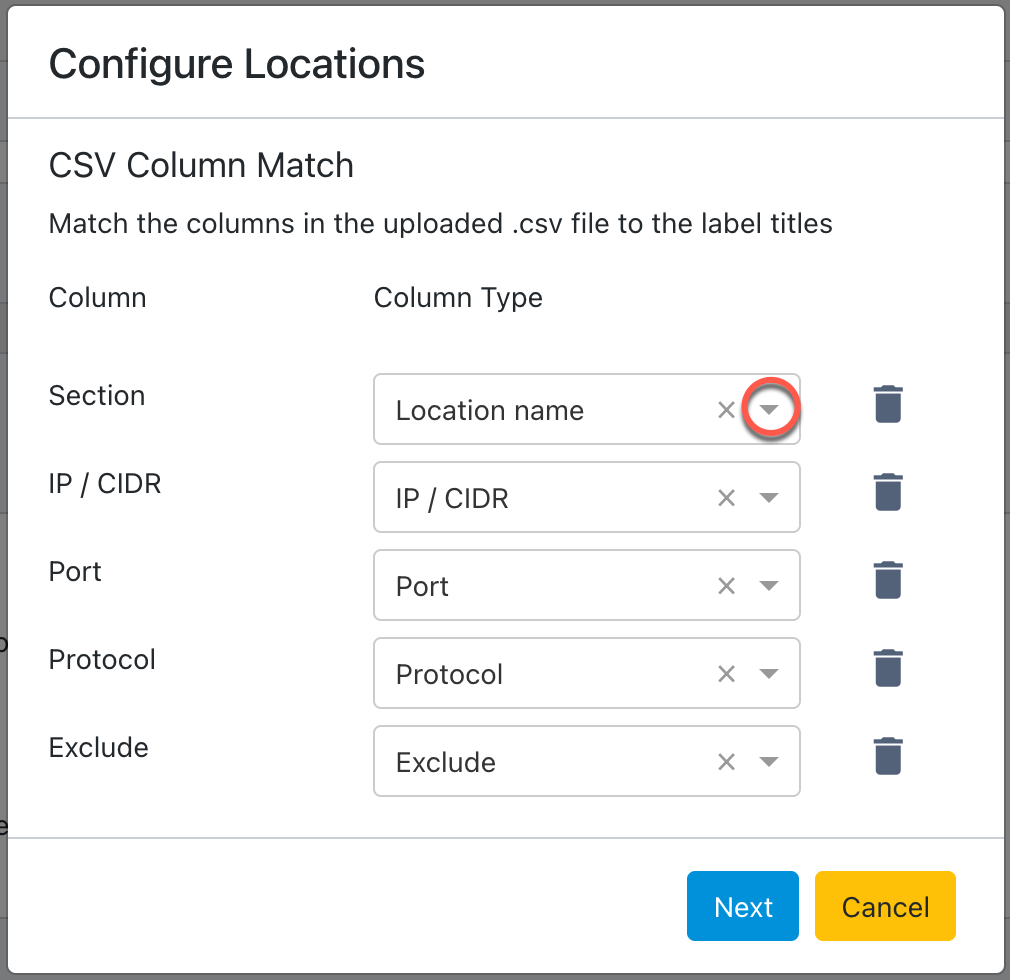
Use the drop-down in each Column Type field to match the label settings to the columns in the uploaded CSV file, and then click Next.
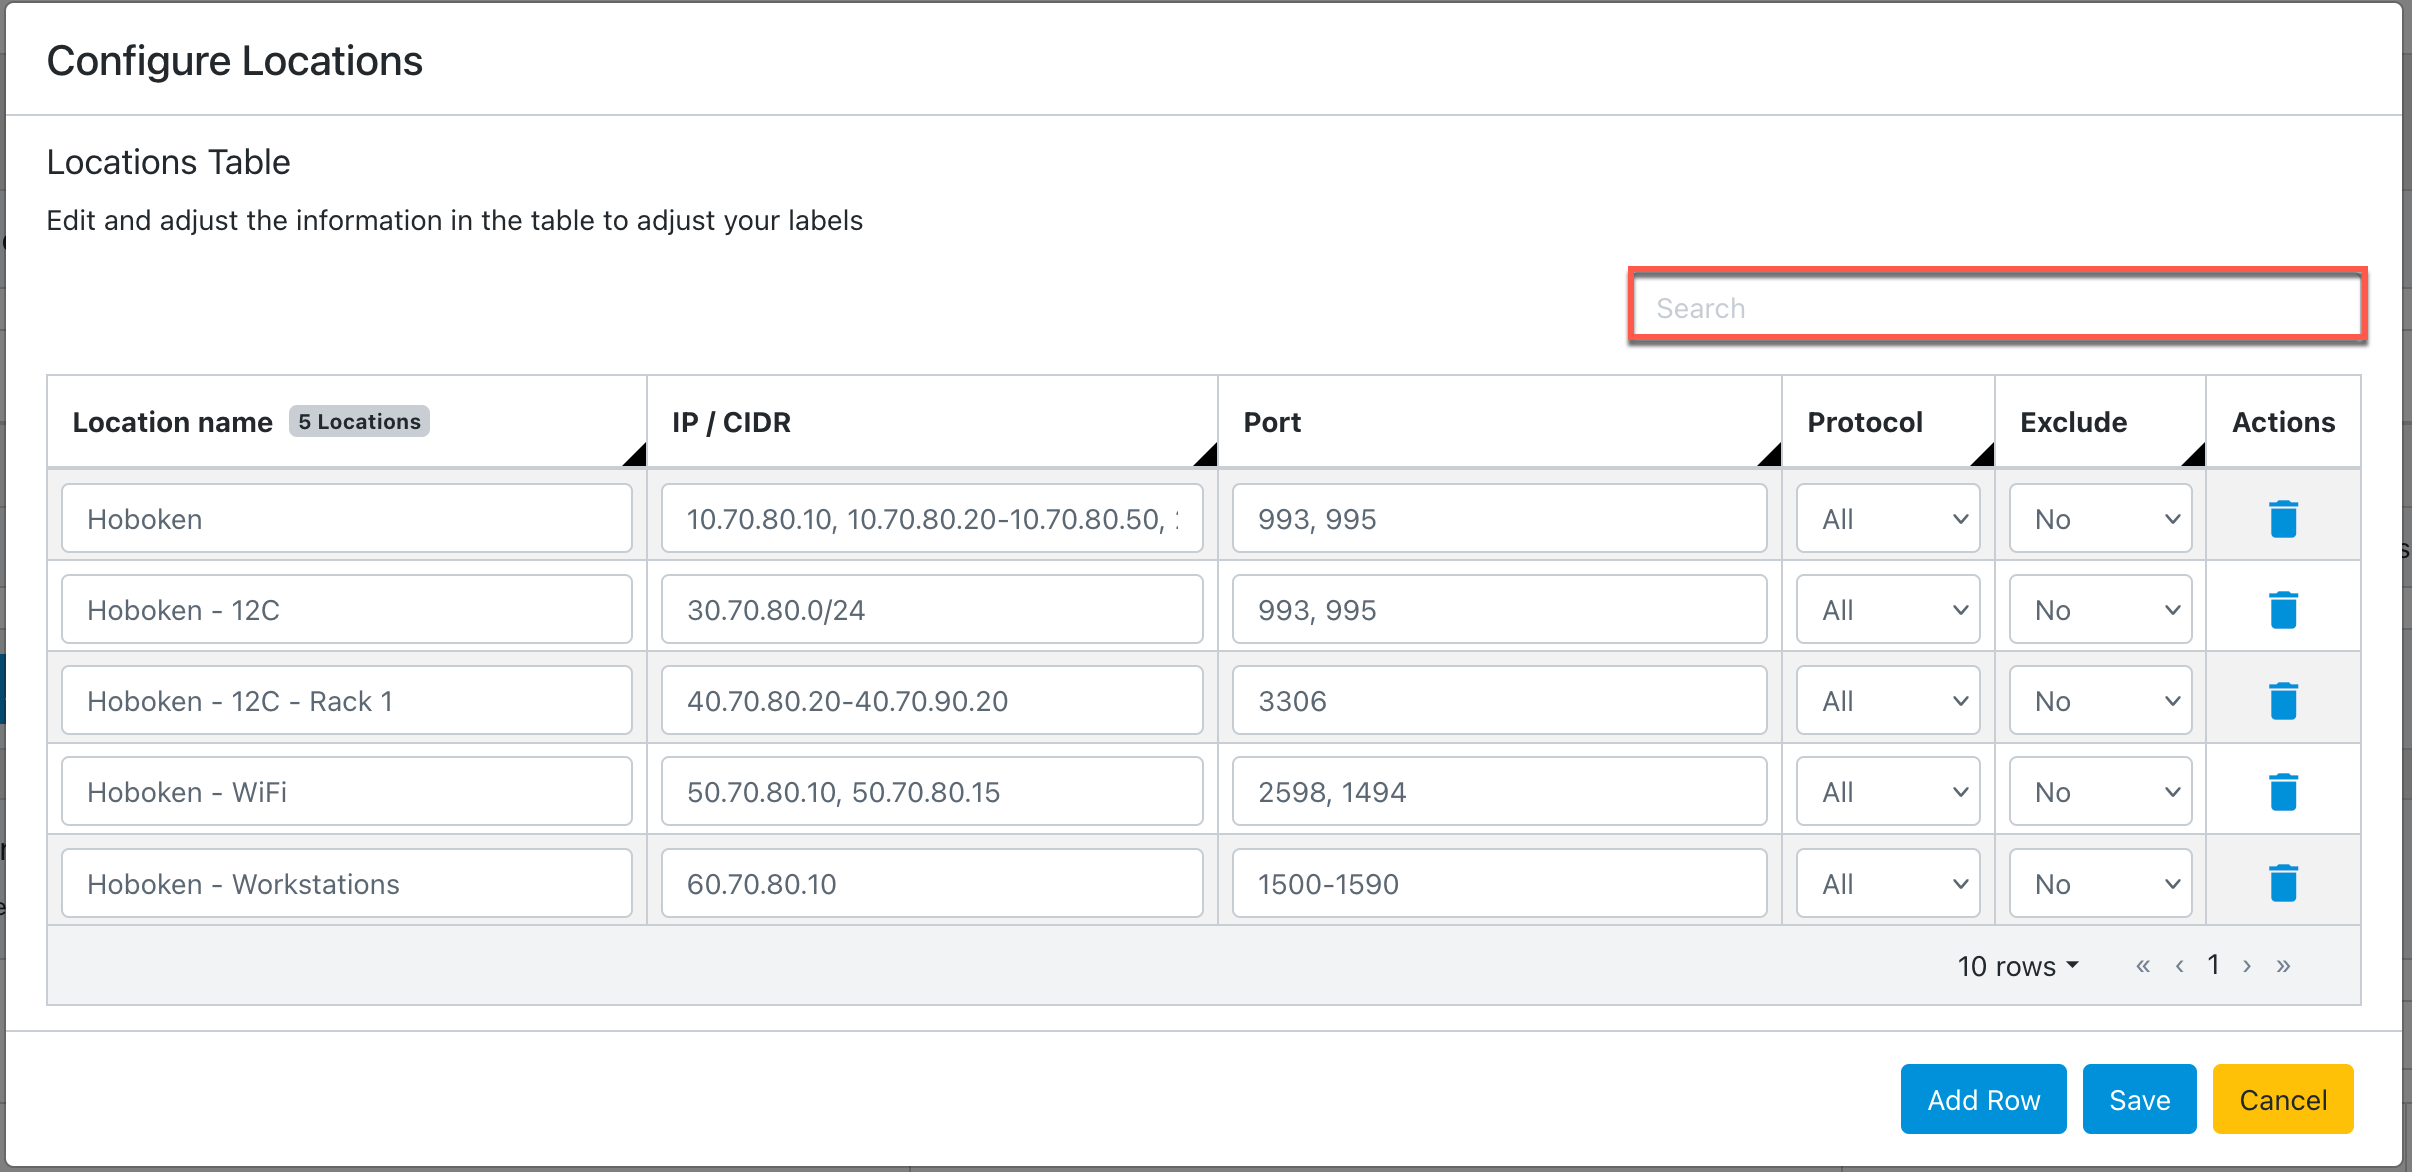
Edit any of the information in the table to adjust your labels. To add an additional label, click Add Row. To remove a label, click delete
in the Actions column.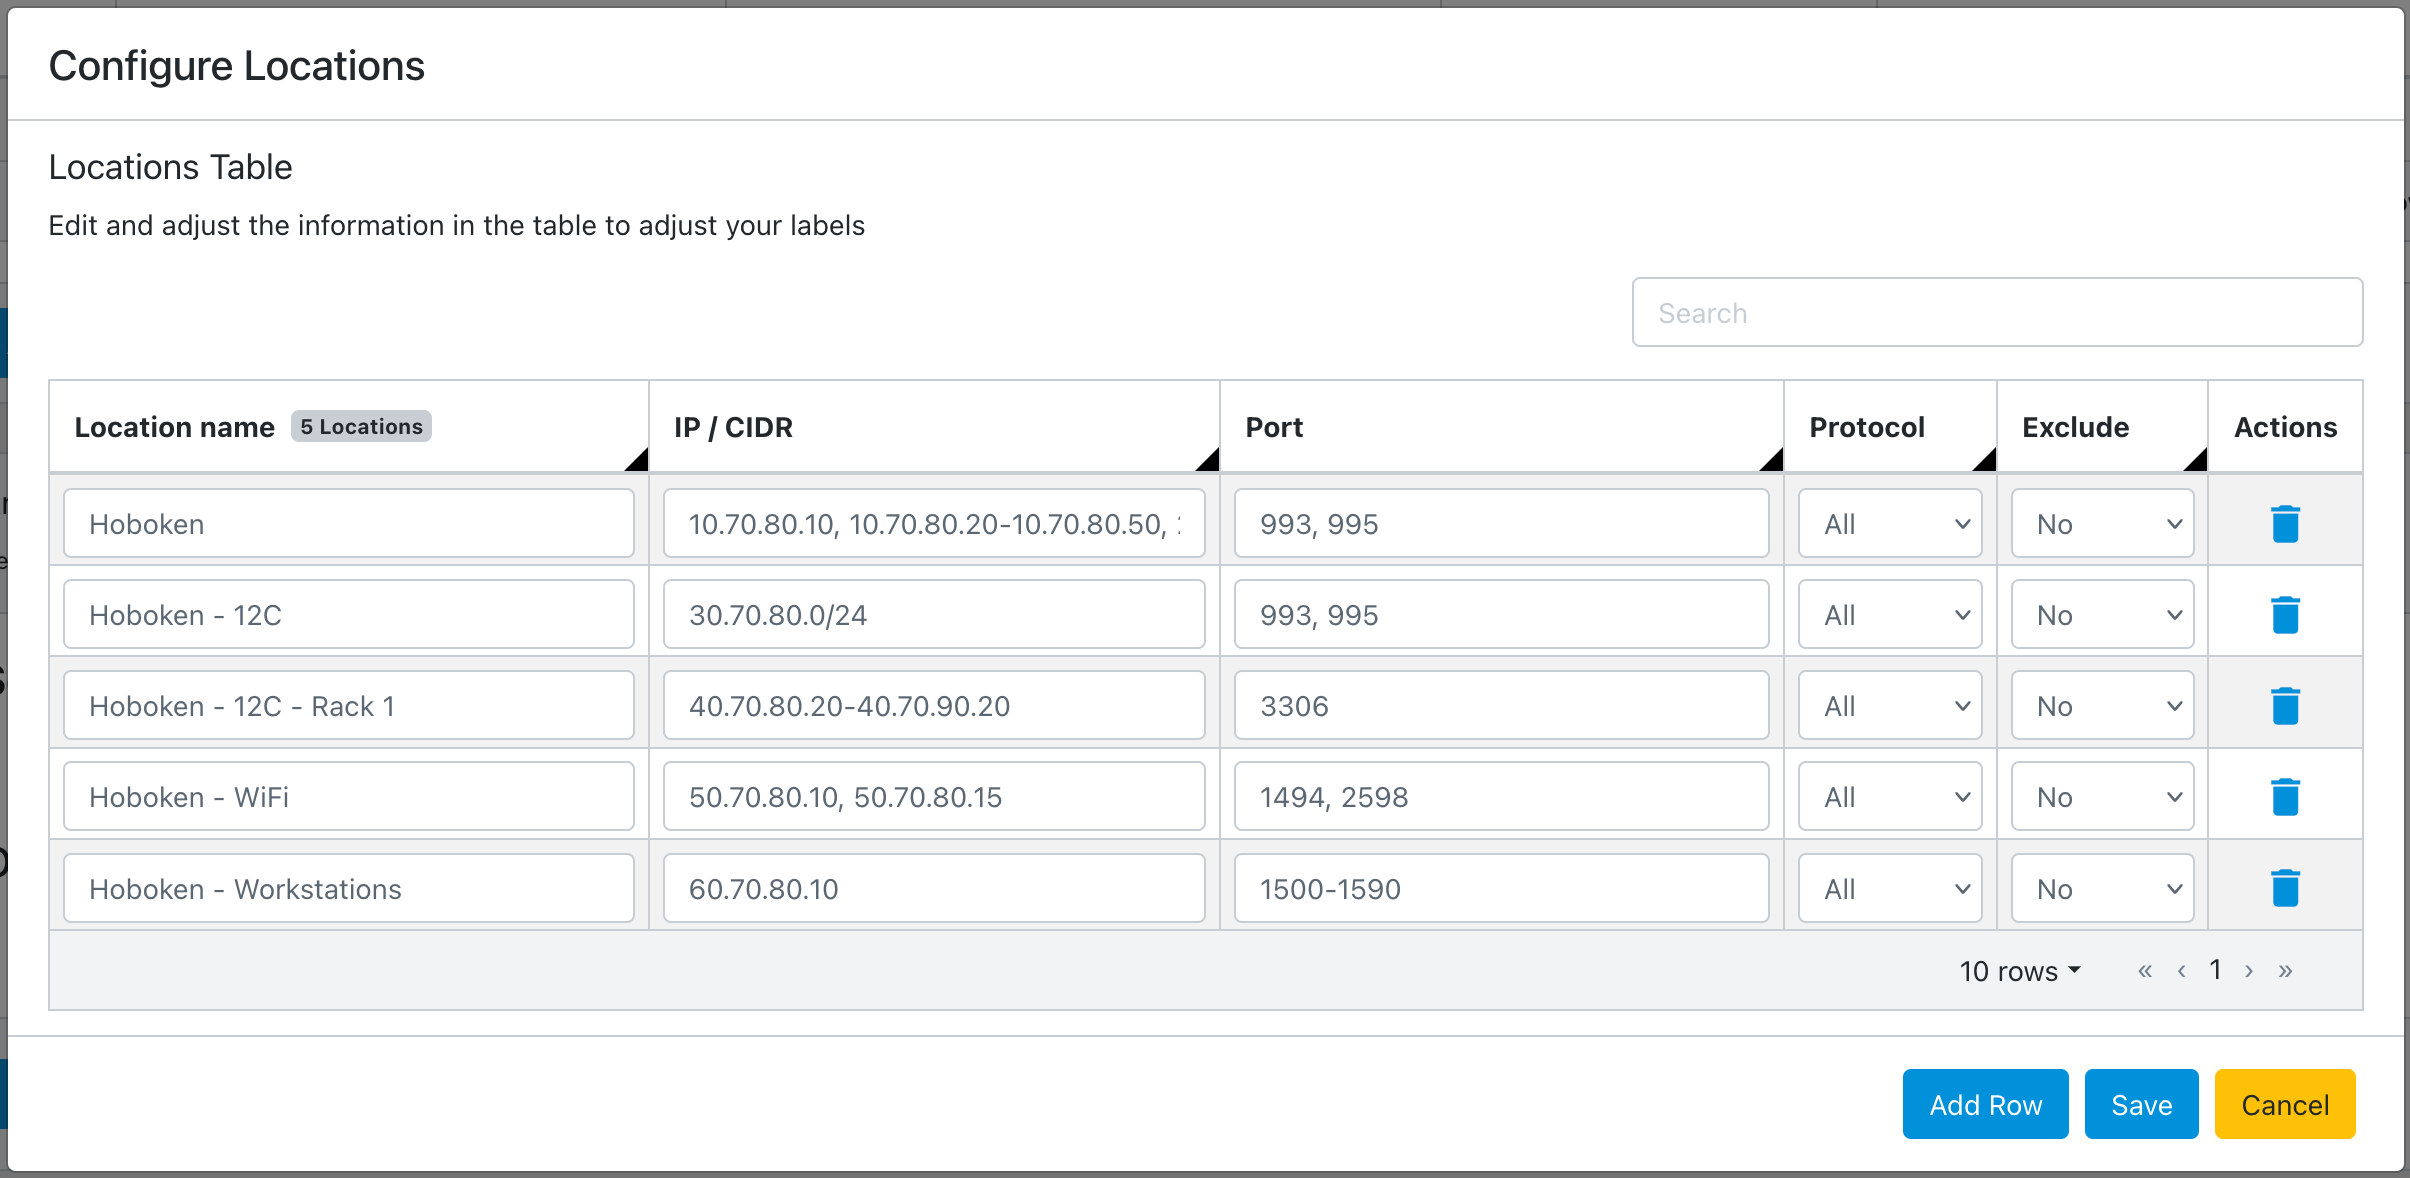
When you finish editing, click Save.
Configured locations are displayed:
Alternatively, you can enter the label configuration manually using the cClear UI. Click Upload > Create From Empty Template. Enter the values from the table in Step 2 and click Save.
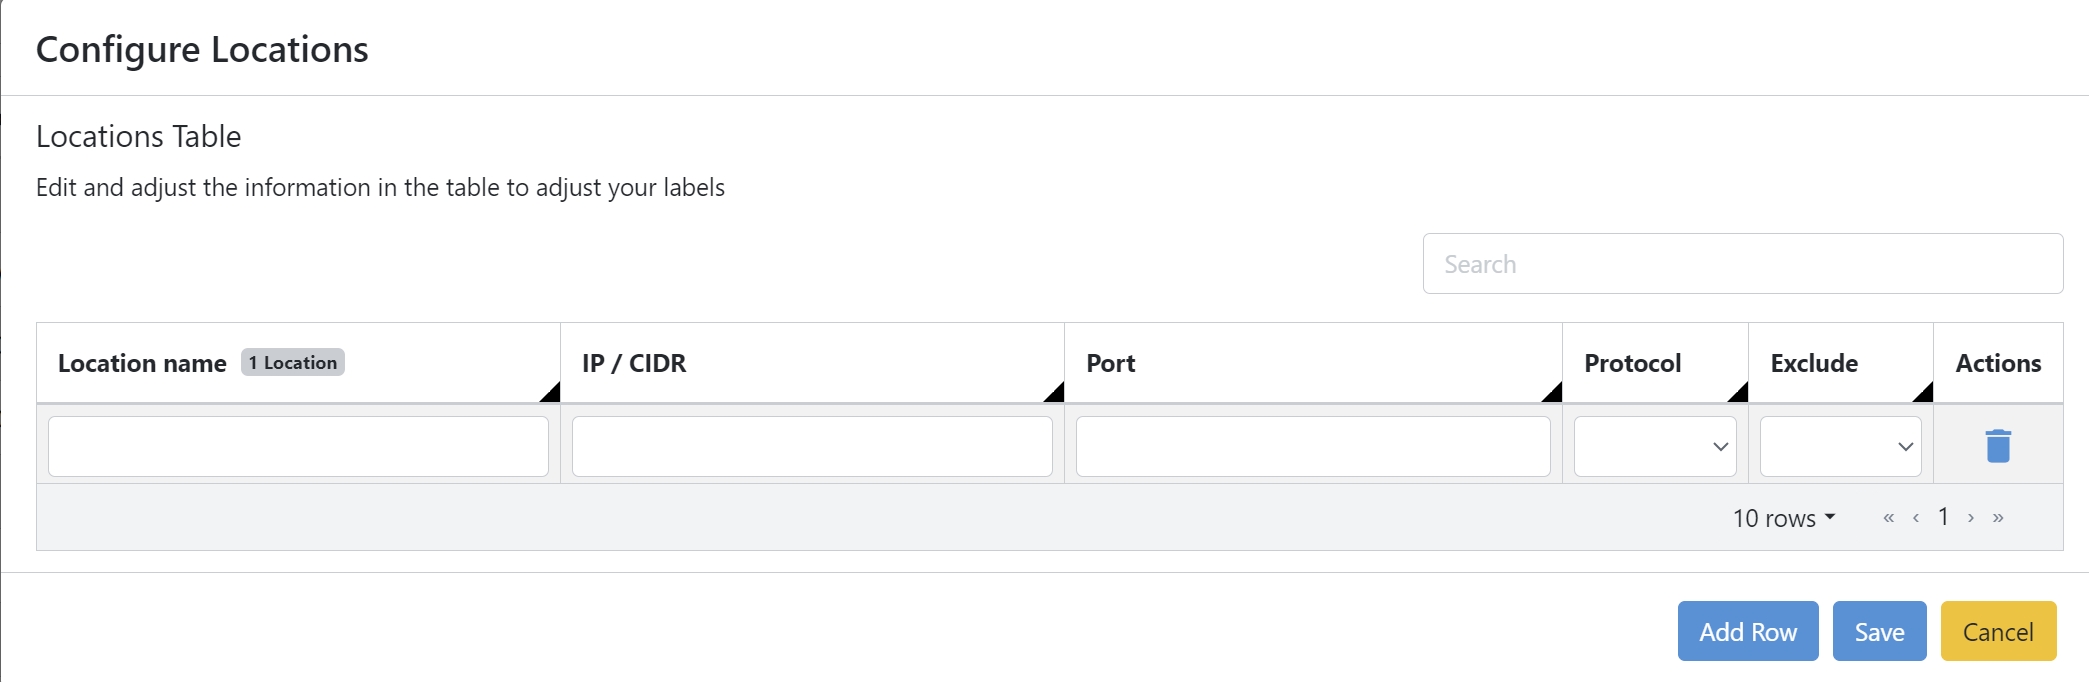
Click Edit to add, modify, or delete individual labels.
Use the search bar on the Locations Table to find the label you are looking for quickly.
Note
If a dashboard from the cPacket Utility Bundle Plugin is imported, it overwrites the previous version of that dashboard. During the plugin update process, if there are specific dashboards you want to keep unchanged, uncheck the corresponding boxes. This will prevent those dashboards from being overwritten by the update.
Go to Observability > Show quick start menu and click Import dashboards.
A new tab will open in the current browser. The cPacket Utility Bundle plugin is displayed. Click Click here to import the selected dashboards below to import the pre-selected list of dashboards. To import other dashboards, select the checkbox next to each dashboard or folder.
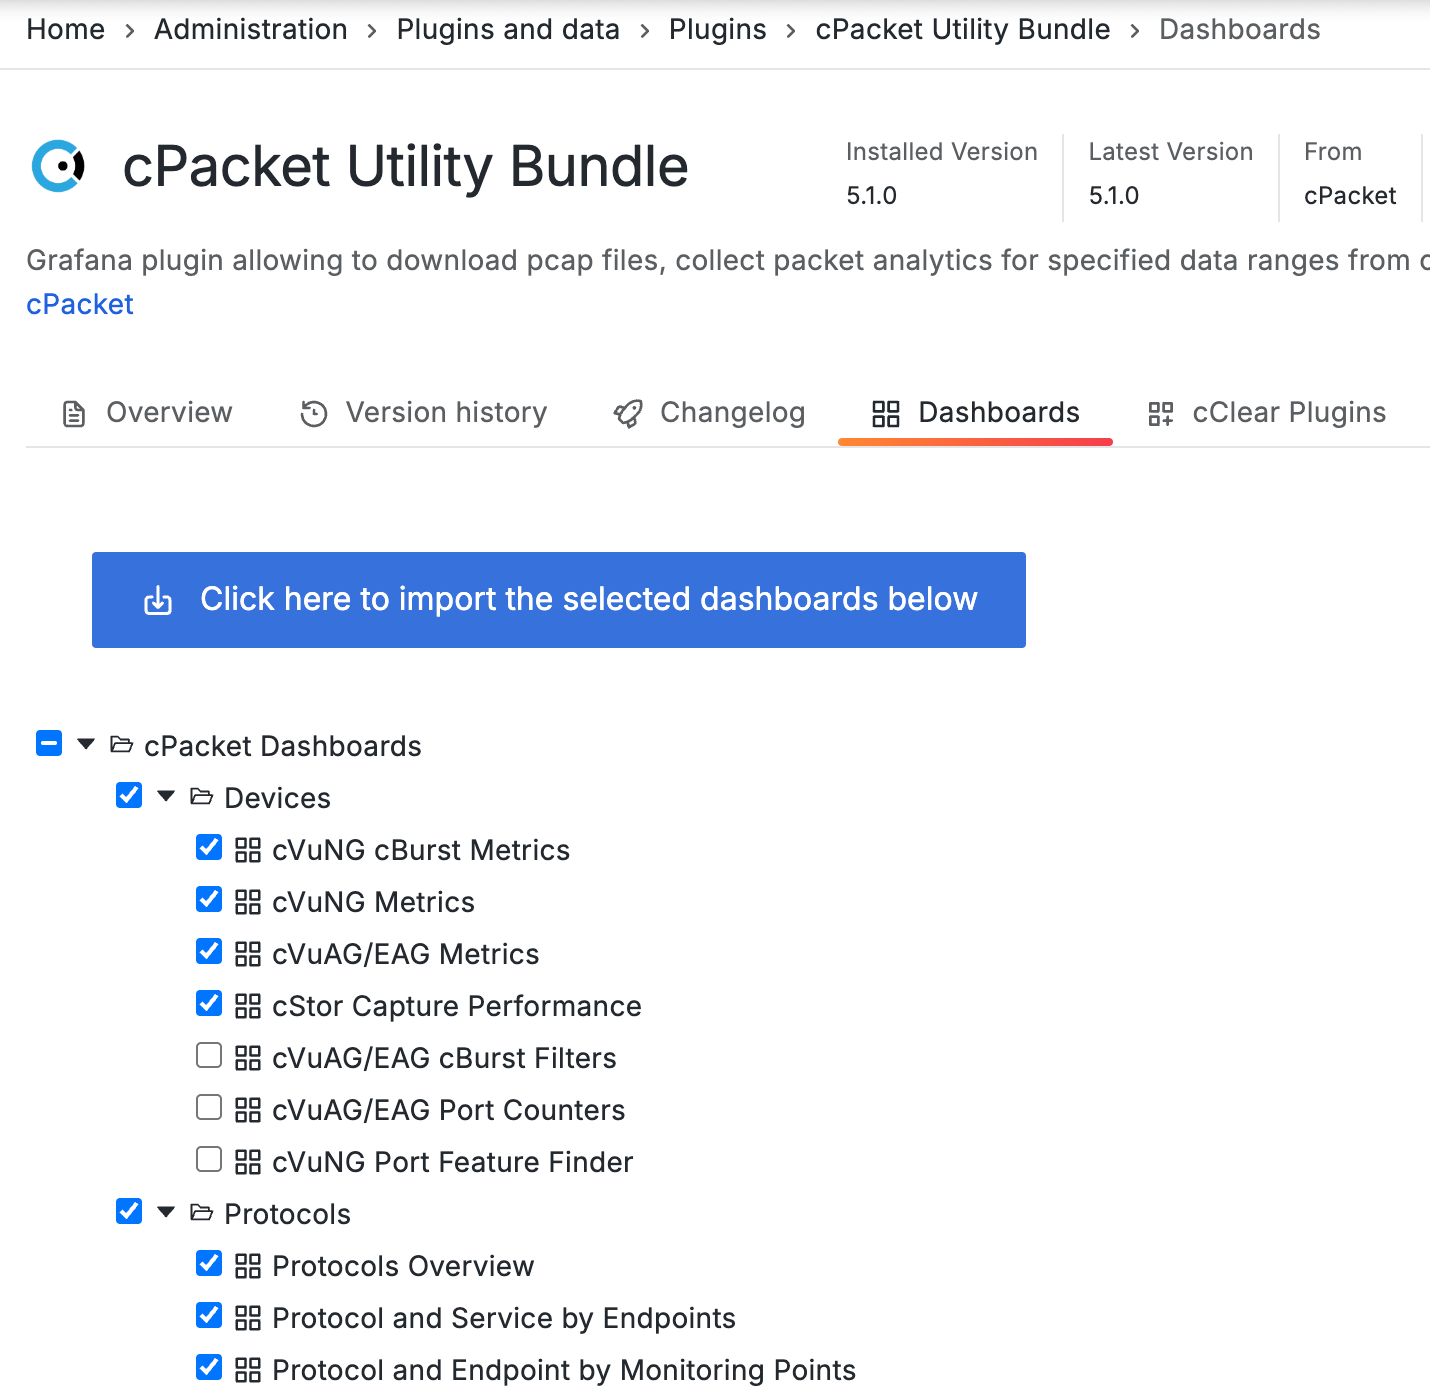
The dashboards are now available to use in Grafana, and the Observability home page dashboard links are active.