6.3.4. On-demand analytics collection
The cPacket Analytics collector panel is used to collect detailed analytics. With one click, it makes the collection request, validates the parameter inputs, and checks the collection status automatically. Level 4 Troubleshooting dashboards always require on-demand analytics collection to access the IP conversation data.
Detailed analytics are designed to be used for troubleshooting, where you can narrow your focus to a specific IP conversation, protocol, and time window for deeper analysis. This allows you to identify the source of network problems quickly. Detailed data is only collected when specifically configured and requested by you so that the network monitor does not overwhelm the database and cause long wait times. The on-demand collector requests data from selected cStors and writes it into the local database for dashboard queries.
Caution
Large time ranges result in a long collection process. To avoid long wait times, we recommend a time range of 5 minutes or less.
 |
To retrieve detailed analytics, run the cPacket Analytics on-demand analytics collector. Different types of analytics data can be collected according to your area of interest.
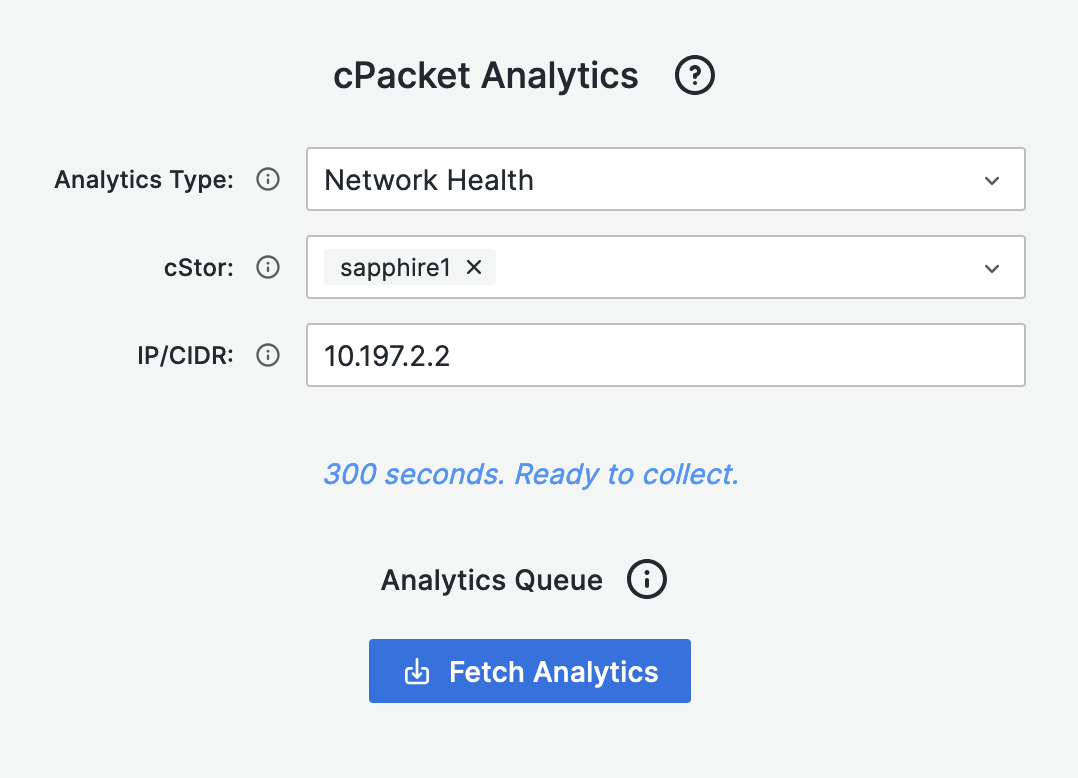
Parameter | Function |
|---|---|
Time range | The recommended time range is between 20 seconds and 5 minutes. Longer time ranges may result in extended wait times. If you set the time range to exceed 5 minutes, confirmation will be required. You can adjust the time range using the selector in the top right corner of the dashboard. |
Analytics type | The analytics type is determined by the network monitor type selected in cClear and is automatically populated. To learn more about the analytics types, see "Network monitors" in the cClear User Guide. |
cStor | The list of cStors comes from the network monitor set in cClear. |
IP/CIDR | The IP or CIDR used to collect analytics from the specified network monitor and is automatically populated. You can enter an IP/CIDR of interest, which should be a subset of or intersect with the network monitor's CIDR. |
To start collecting analytics, click the Fetch Analytics button in the cPacket Analytics panel. A request is sent every 2 seconds, and the panel displays the status. A timer records the duration until completion. Once finished, a message indicates the time taken and whether the process succeeded with data or failed, including any exception details.
To view the data, click Refresh dashboard  in the top right corner. This will trigger a new query to the database. Once executed successfully, the dashboard panels will display the collected analytics.