6.3.1. Metrics for advanced analysis
The Level 3 and Level 4 Troubleshooting dashboards provide advanced, targeted analysis for diagnosing performance issues related to specific endpoints. Use the selector in the dashboard title to choose a metric group. Your selection controls the metrics shown in both the line chart and the table. You can change the selection at any time to explore different aspects of your network performance. When the dashboard is loading data, a blue progress bar appears above the chart and table. Wait for the bar to disappear before reviewing metrics. Scroll across the table to see all available data.
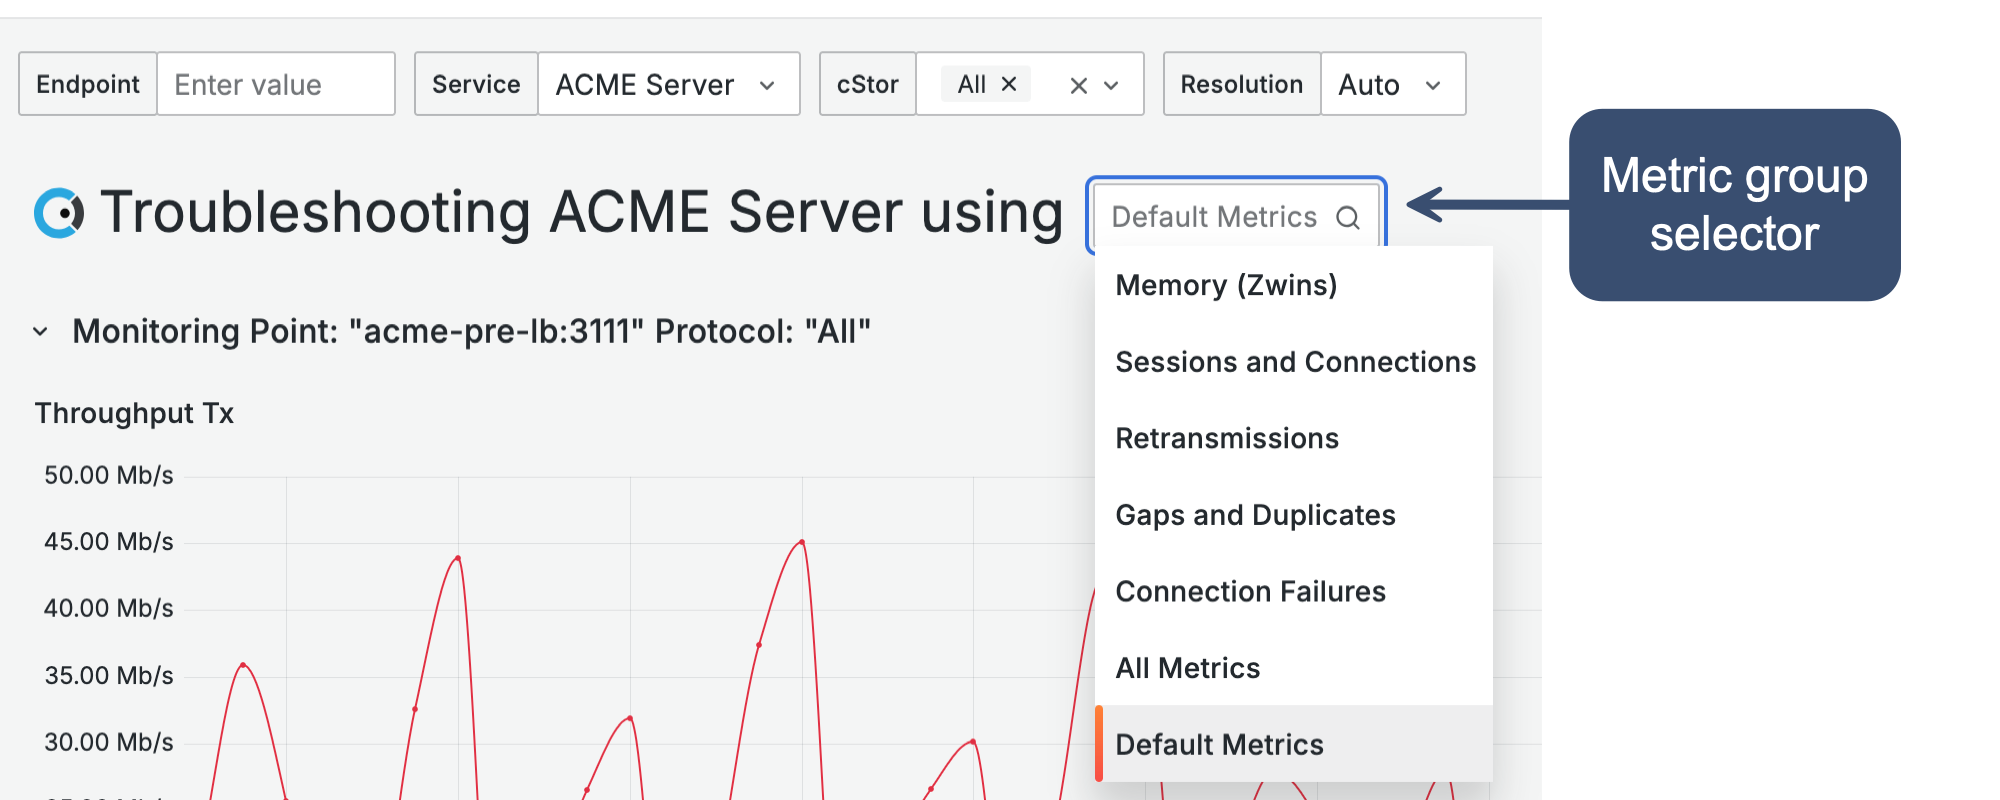 |
Metrics are systematically organized into groups to facilitate the identification and resolution of various observed issues. The following table details the available metrics for each group: Default, Memory (ZWins), Sessions and Connections, Retransmissions, Gaps and Duplicates, Connection Errors, and All Metrics.
Metric | Default | Memory (ZWins) | Sessions and Connections | Retransmissions | Gaps and Duplicates | Connection Failures | All Metrics |
|---|---|---|---|---|---|---|---|
Y | Y | Y | Y | Y | Y | Y | |
Y | Y | Y | Y | Y | Y | Y | |
Y | Y | Y | Y | Y | N | Y | |
N | N | N | N | Y | N | Y | |
N | N | N | N | Y | N | Y | |
N | N | N | N | N | Y | Y | |
N | N | N | N | N | Y | Y | |
N | N | N | N | N | Y | Y | |
N | N | N | N | N | Y | Y | |
N | N | N | N | Y | N | Y | |
N | N | N | N | Y | N | Y | |
N | N | Y | N | N | Y | Y | |
N | N | Y | N | N | N | Y | |
N | N | N | N | N | Y | Y | |
Y | Y | Y | Y | Y | Y | Y | |
Y | Y | Y | Y | Y | Y | Y | |
N | N | Y | N | N | Y | Y | |
N | N | Y | N | N | Y | Y | |
N | N | Y | Y | Y | N | Y | |
N | N | Y | N | N | Y | Y | |
N | N | Y | N | N | N | Y | |
N | N | N | N | N | Y | Y | |
Y | Y | Y | Y | Y | Y | Y | |
Y | Y | Y | Y | Y | Y | Y | |
N | N | Y | Y | Y | N | Y | |
N | N | Y | Y | Y | N | Y | |
N | N | Y | Y | Y | N | Y | |
N | N | N | N | N | Y | Y | |
N | N | N | N | N | Y | Y | |
N | N | N | Y | Y | N | Y | |
N | N | N | Y | Y | N | Y | |
Y | Y | Y | Y | Y | N | Y | |
N | N | Y | N | N | Y | Y | |
N | N | Y | N | N | Y | Y | |
N | N | Y | N | N | Y | Y | |
N | N | Y | N | N | Y | Y | |
N | N | Y | N | N | Y | Y | |
N | N | Y | N | N | Y | Y | |
Y | Y | Y | Y | Y | Y | Y | |
Y | Y | Y | Y | Y | Y | Y | |
N | Y | Y | N | N | N | Y | |
N | Y | Y | N | N | N | Y |