6.2.1. Interact with the table
Sort by value in table columns
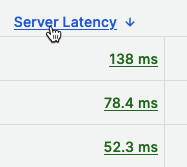
Click a column header to change the sort order from default to ascending to descending. Each time you click, the sort order changes to the next option in the cycle.
 |
Filter by column
Filter within the table to display only the values you are interested in by selecting one or more values.
Click filter
 next to a column title.
In the search field, type the string to be matched or select one or more values from the list. The input type is based on the selected category.
Click Ok to apply the filter.
Clear column filters
Columns with filters applied have a blue funnel displayed next to the column title.
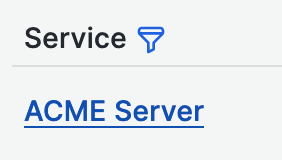 |
To remove the filter, click the blue filter  and then click Clear filter.
Filter using tag data links
Use the tag data links to filter your data, which helps you refine the scope of your search results and gain meaningful insights into your data. Click a tag, which appears in the table in blue text, to see the available filtering options. Note: The dashboard links take you to other dashboards in the workflow.
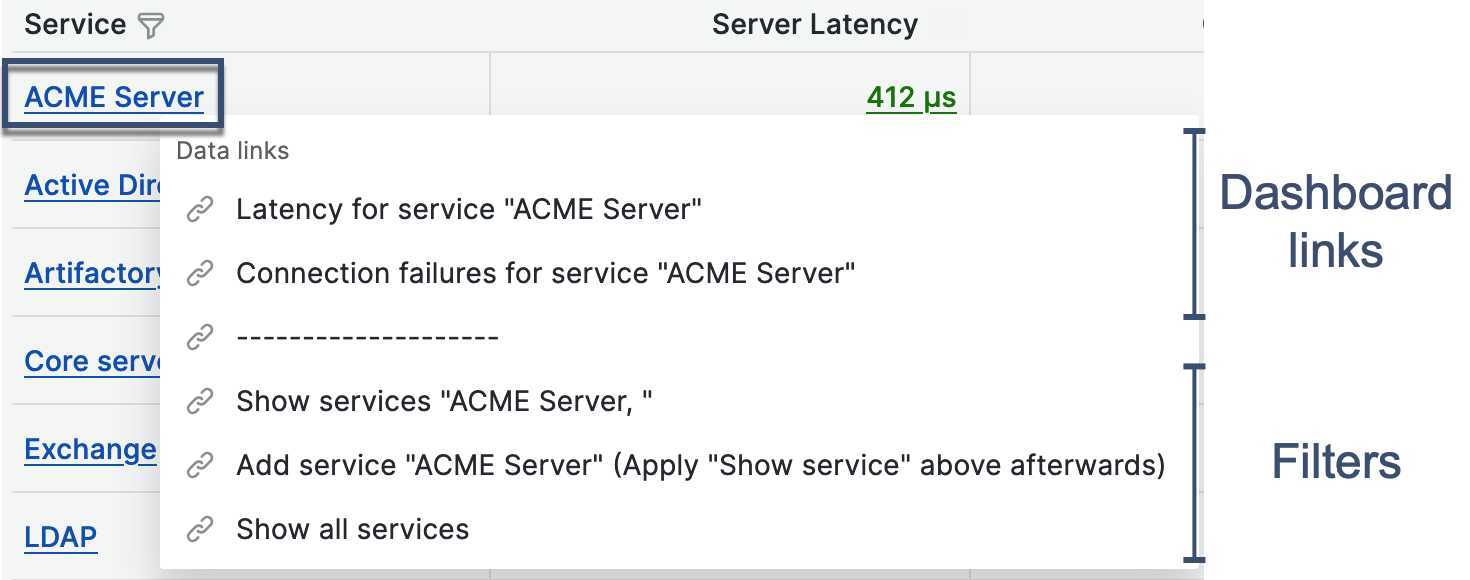 |
Three filter options apply the filter to both the graph and the table:
Show displays only the selected value.
Add is a two-step process that adds one value at a time. Once values are selected, use Show to apply the selected filters.
Show all resets the filter to display all values.
Display a different metric
To change the metric displayed in the graph, click a metric, which appears in the table in green text, to see the display options.
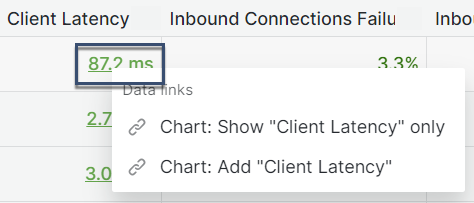 |
Two options apply the metric to the graph:
Show - displays only the selected metric on the graph.
Add - adds the selected metric to existing data points on the graph.
Drill down from the table
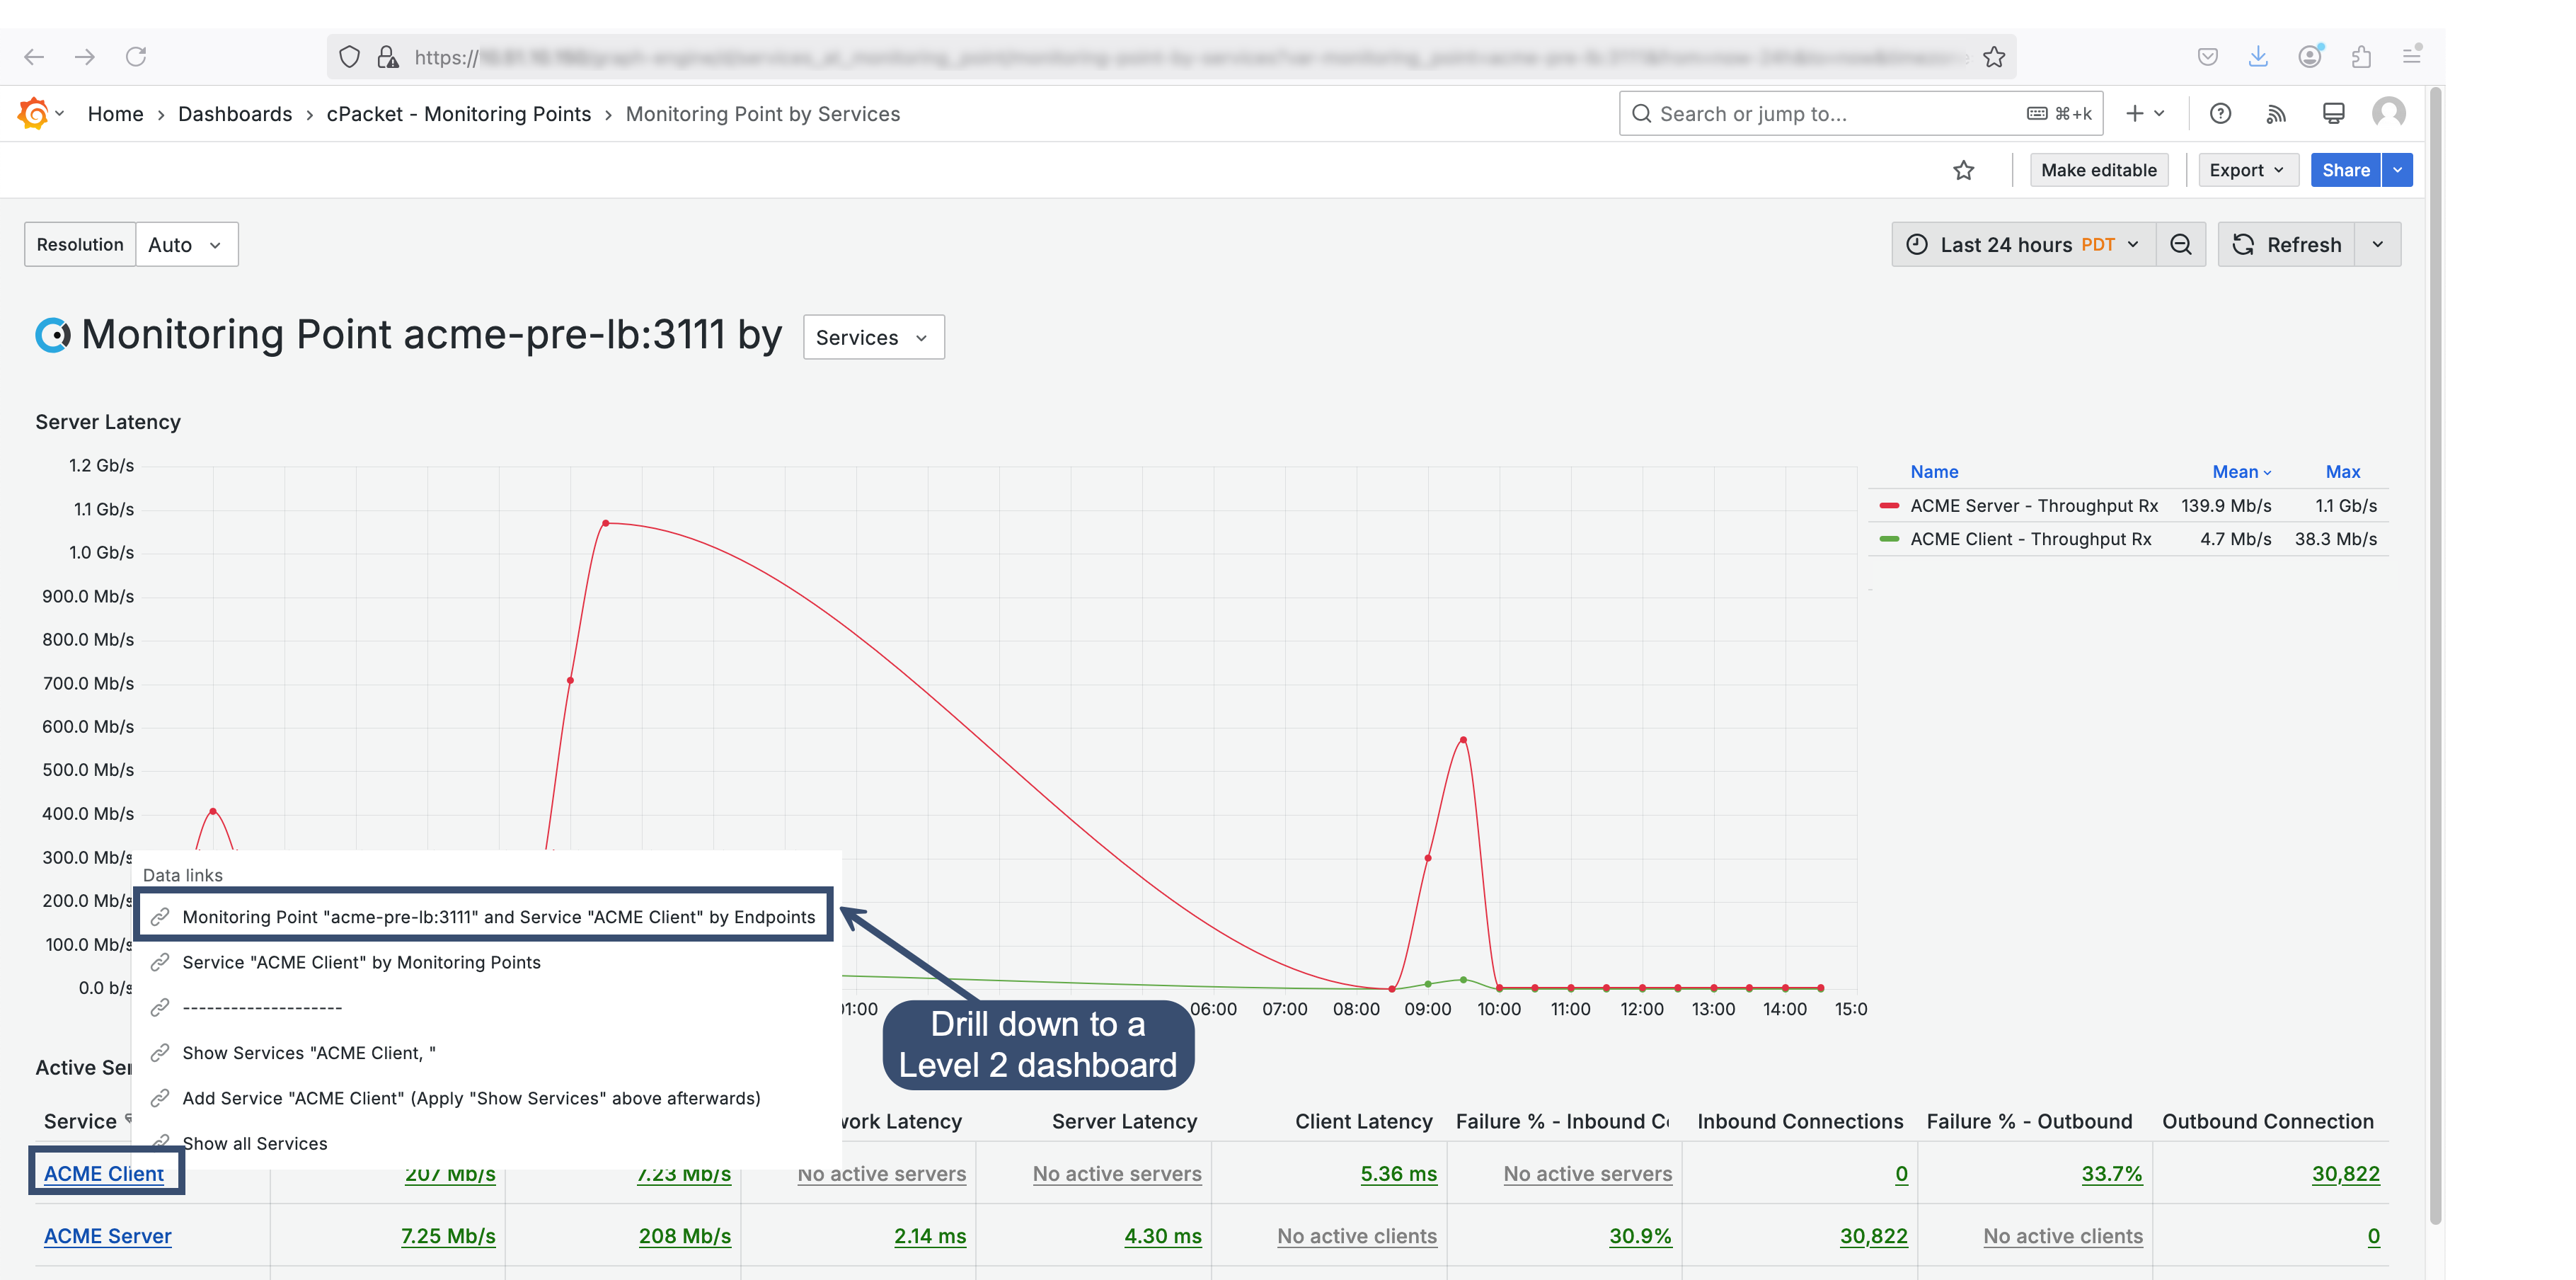
The tags in the table contain data links to drill down into the workflow. Drilling down is the process of moving from a more general view to a more detailed view. For example, you might start by looking at the overall performance metrics for all of your services and then drill down into a specific endpoint to inspect more detailed metrics.
The purpose of drilling down is to help you identify the root cause of any issues and understand the context and causes of your network's behavior, not just observe the behavior itself. The tag data links serve as navigational targets to other dashboards. Click the tag to display the data links available. Any data link above the dashed line --- is a dashboard you can navigate to. Data links dynamically transfer contextual information about the metadata you are viewing to the linked dashboard.
In the following example, the Monitoring Point by Services dashboard, categorized as a Level 1 dashboard within the Explore Monitoring Points workflow, focuses on the monitoring point acme-pre_lb and includes the services ACME Client and ACME Server, visible in the table's tag column.
Using the data link in the table, you can drill down to investigate the endpoints associated with the acme-pre_lb monitoring point and the service ACME Client. This option will navigate you to the Level 2 dashboard titled Monitoring Point and Service by Endpoints.