4.4. Location connection failures workflow
This drill-down workflow is designed to analyze connection failures for your locations, which are configured using analytics labels. It includes eleven dashboards organized across four hierarchical levels, drilling down from the Locations Overview dashboard to the more detailed Troubleshooting dashboards. Dashboards in this workflow can traverse up, down, and across to switch views and perspectives on the same data set. Zoom out by using the browser's back button or navigate laterally to dashboards with the same level of detail but from different perspectives, such as endpoints, protocols,monitoring points, or peers. To learn more, see Navigate the workflows
The following diagram gives you an overview of the different dashboards and their hierarchical relationship:
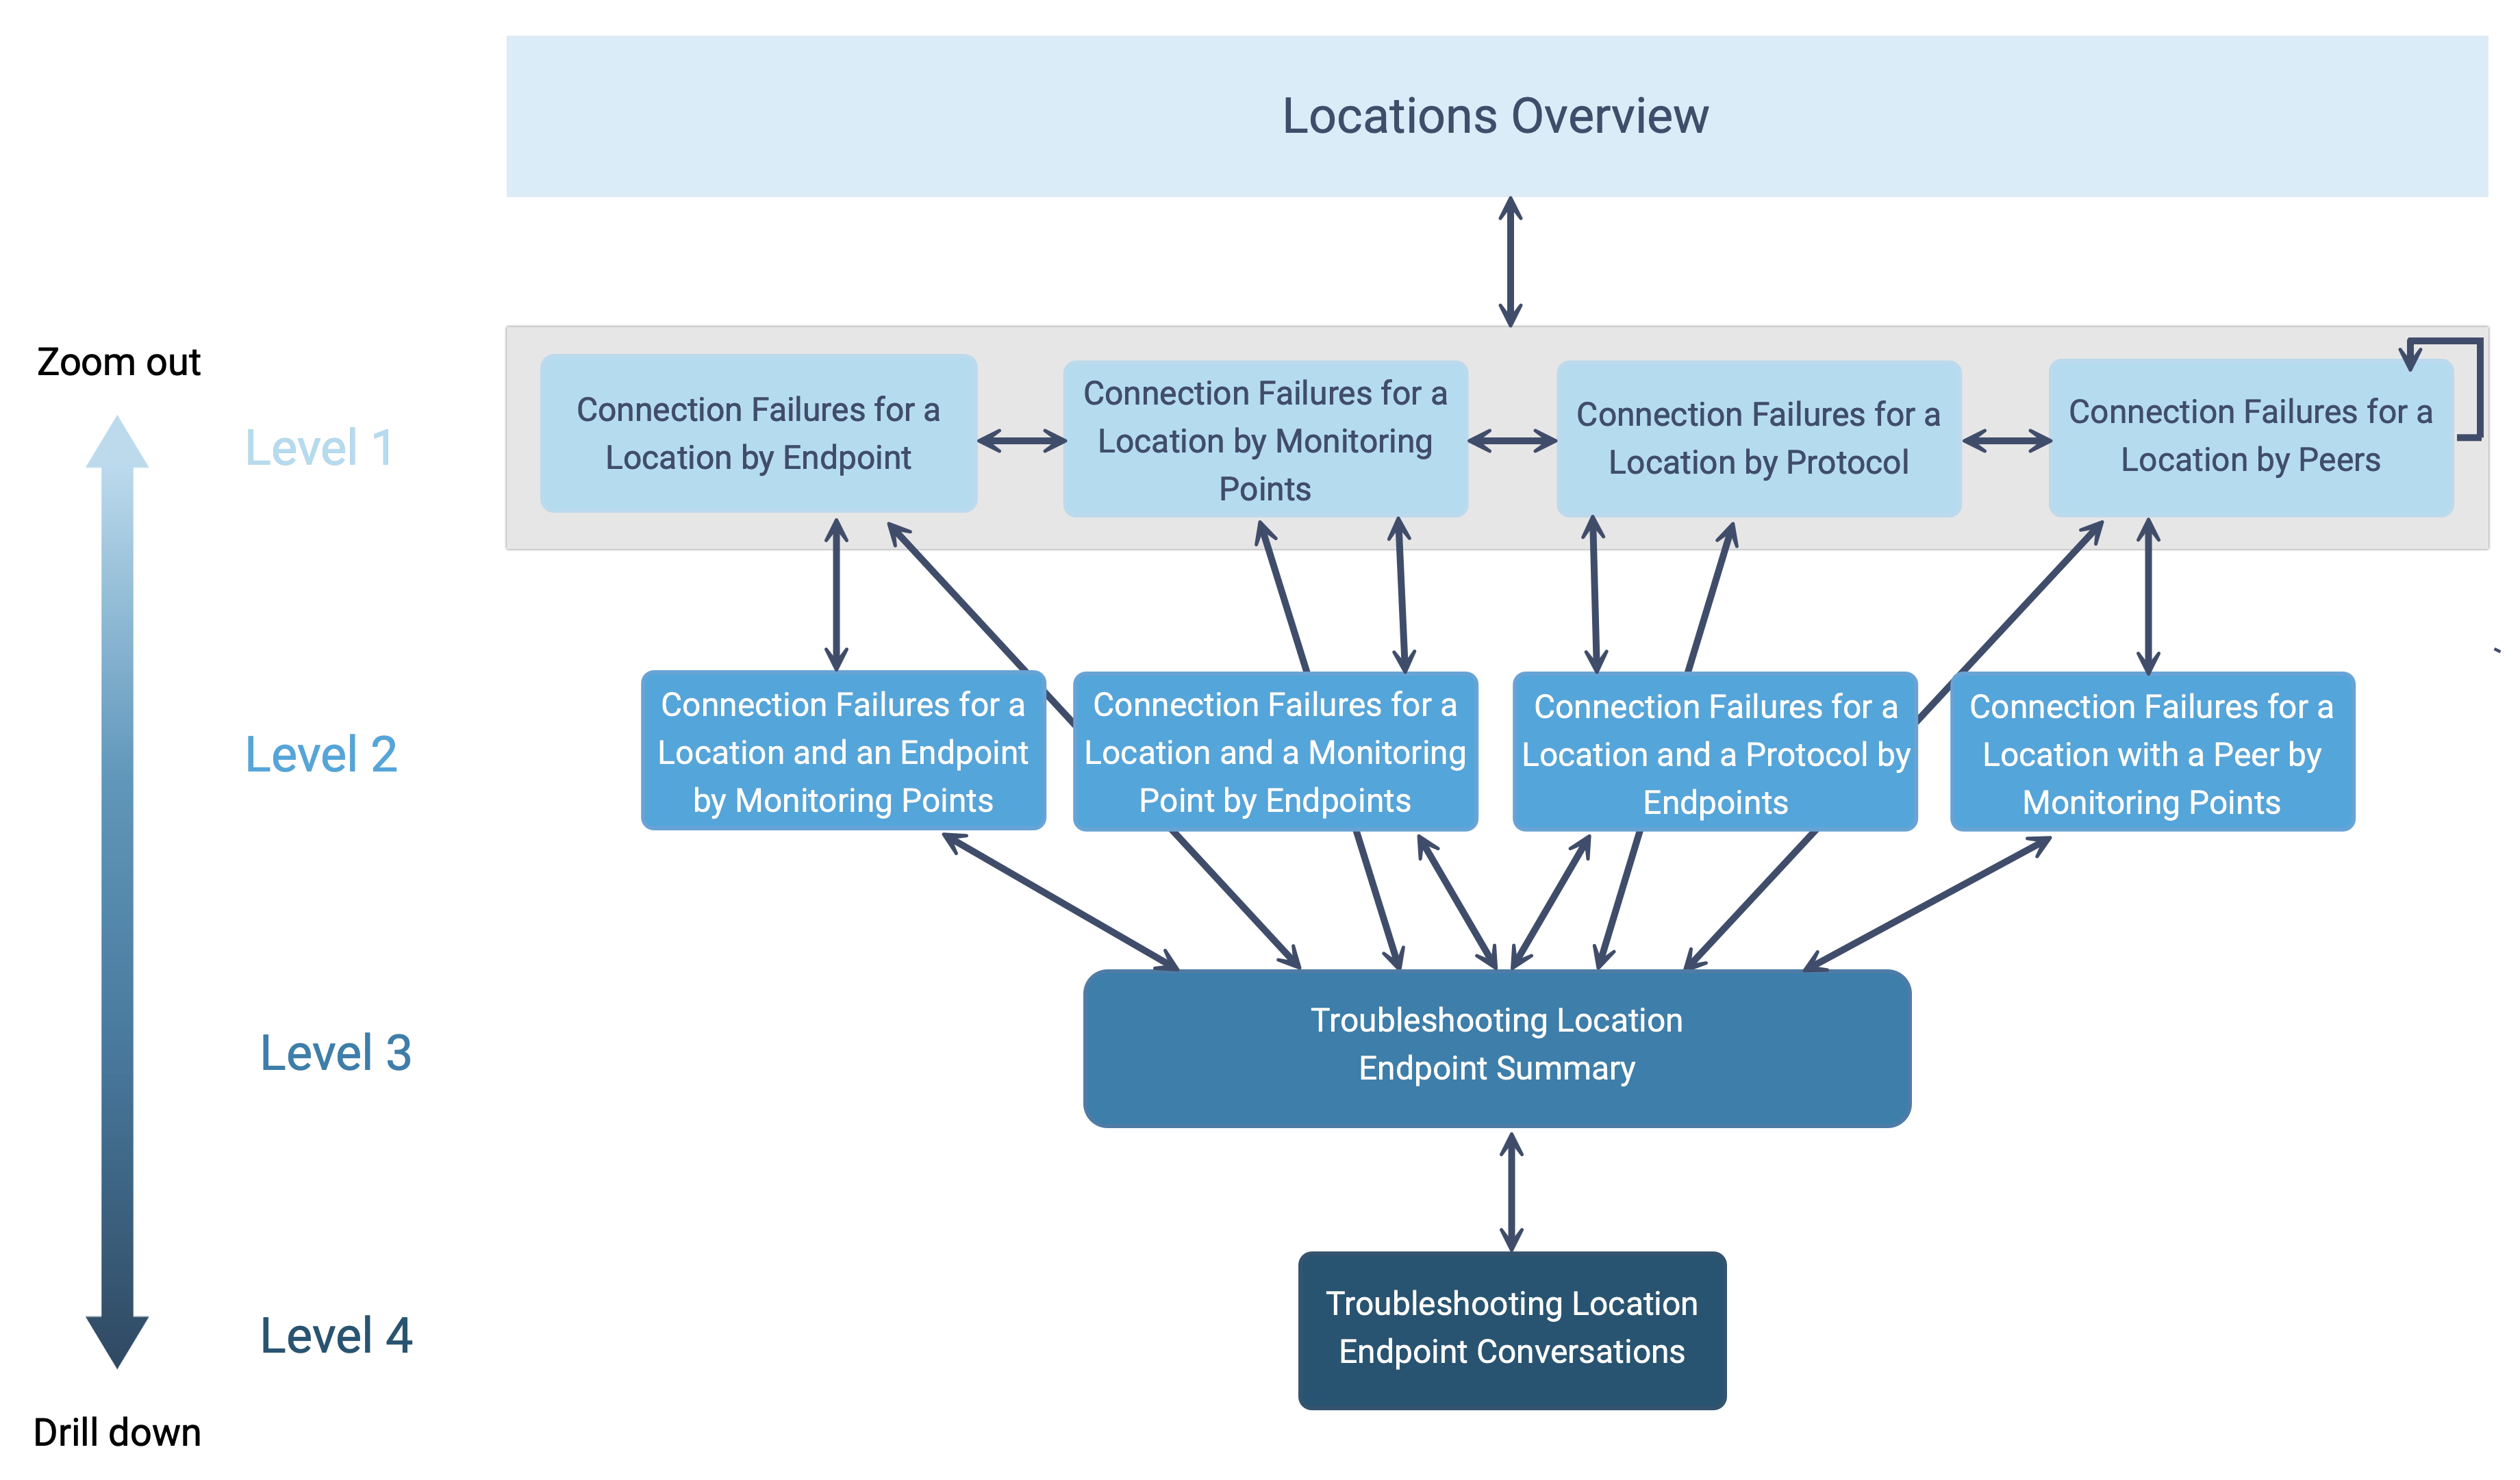
The following information summarizes each level of the workflow:
- Location Connection Failures Overview
The Locations Overview is the top level of the Location Connection Failures workflow. Here, all of your custom locations that have been active for the last 24 hours are listed.
Using a time-series database, metrics such as server latency, client latency, percentage of inbound and outbound connection failures, and the total number of inbound and outbound connections for each location are visualized and analyzed in real-time. The default metric displayed on the graph is server latency.
- Level 1
The Level 1 dashboard is designed to help you determine the health and performance of your locations. It compares connection metrics across various aspects of the service, such as monitoring points, endpoints, protocols, and peers. The default metric displayed on the graph is failure % - inbound connections.
When the host acts as a server, metrics are displayed for the percentage of inbound connection failures, inbound connections, SYN Rx, and SYNACK Tx. Conversely, metrics are shown for the percentage of outbound connection failures, outbound connections, SYN Tx, and SYNACK Rx when the host acts as a client. You will see both sets of metrics if the host has acted as a server and a client.
One variable for Resolution is available at the top of the dashboard. To learn more about this variable, see Dashboard variables.
Level 1 dashboards include:
Connection Failures for a Location by Endpoints
Connection Failures for a Location by Monitoring Points
Connection Failures for a Location by Protocols
Connection Failures for a Location by Peers
- Level 2
Level 2 dashboards help narrow down the source of connection issues. You select a specific location and examine metrics at a distinct monitoring point, endpoint, or peer associated with that location. The same metrics are available for Level 1 and Level 2 dashboards, which focus only on connections. The default metric displayed on the graph is failure % - inbound connections.
When the host acts as a server, metrics are displayed for the percentage of inbound connection failures, inbound connections, SYN Rx, and SYNACK Tx. Conversely, metrics are shown for the percentage of outbound connection failures, outbound connections, SYN Tx, and SYNACK Rx when the host acts as a client. You will see both sets of metrics if the host has acted as a server and a client.
One variable for Resolution is available at the top of the dashboard. To learn more about this variable, see Dashboard variables.
Level 2 dashboards include:
Connection Failures for a Location and an Endpoint by Monitoring Points
Connection Failures for a Location and a Monitoring Point by Endpoints
Connection Failures for a Location and a Protocol by Endpoints
Connection Failures for a Location with a Peer by Monitoring Points
- Level 3
The Level 3 dashboard, Troubleshooting Location (Endpoint Summary), is used to troubleshoot connection issues for a location at specific endpoints. If the IP address is known, you can start troubleshooting directly from this dashboard. As a starting point, it provides various metrics such as throughput Tx, throughput Rx, packets Tx, packets Rx, bytes Tx, bytes Rx, maximum flows Tx, maximum flows Rx, and server latency. The default metric displayed on the graph is throughput Tx. Additional metrics are grouped to help troubleshoot different types of observed issues. To learn more, see Metrics for advanced analysis.
Four variables are available at the top of the dashboard: Endpoint, Service, cStor, and Resolution. To learn more about these variables, see Dashboard variables.
PCAP files can be downloaded for a particular endpoint from the cStor Download tag or a specified range using the cPacket Capture panel. To learn more, see Capture packet data.
- Level 4
The level 4 dashboard, Troubleshooting Location (Endpoint Conversations), is utilized for advanced and targeted analysis of a specific data point or narrow time range. An on-demand fetch of the analytics is always required using the cPacket Analytics panel. To learn more, see On-demand analytics collection.
Six variables are available at the top of the dashboard: Endpoint, Peer, Location, cStor, Resolution, and Include Excluded Locations. To learn more about these variables, see Dashboard variables.
See Level 3 for metric and packet capture information.