3. Observability page
The Observability page provides a centralized starting point for exploring network health and activity. It surfaces key metrics derived from connected devices and analytics labels and links directly to Grafana dashboards for deeper analysis.
Use this page to understand current conditions at a glance and navigate to detailed Observability dashboards that support investigation and troubleshooting.
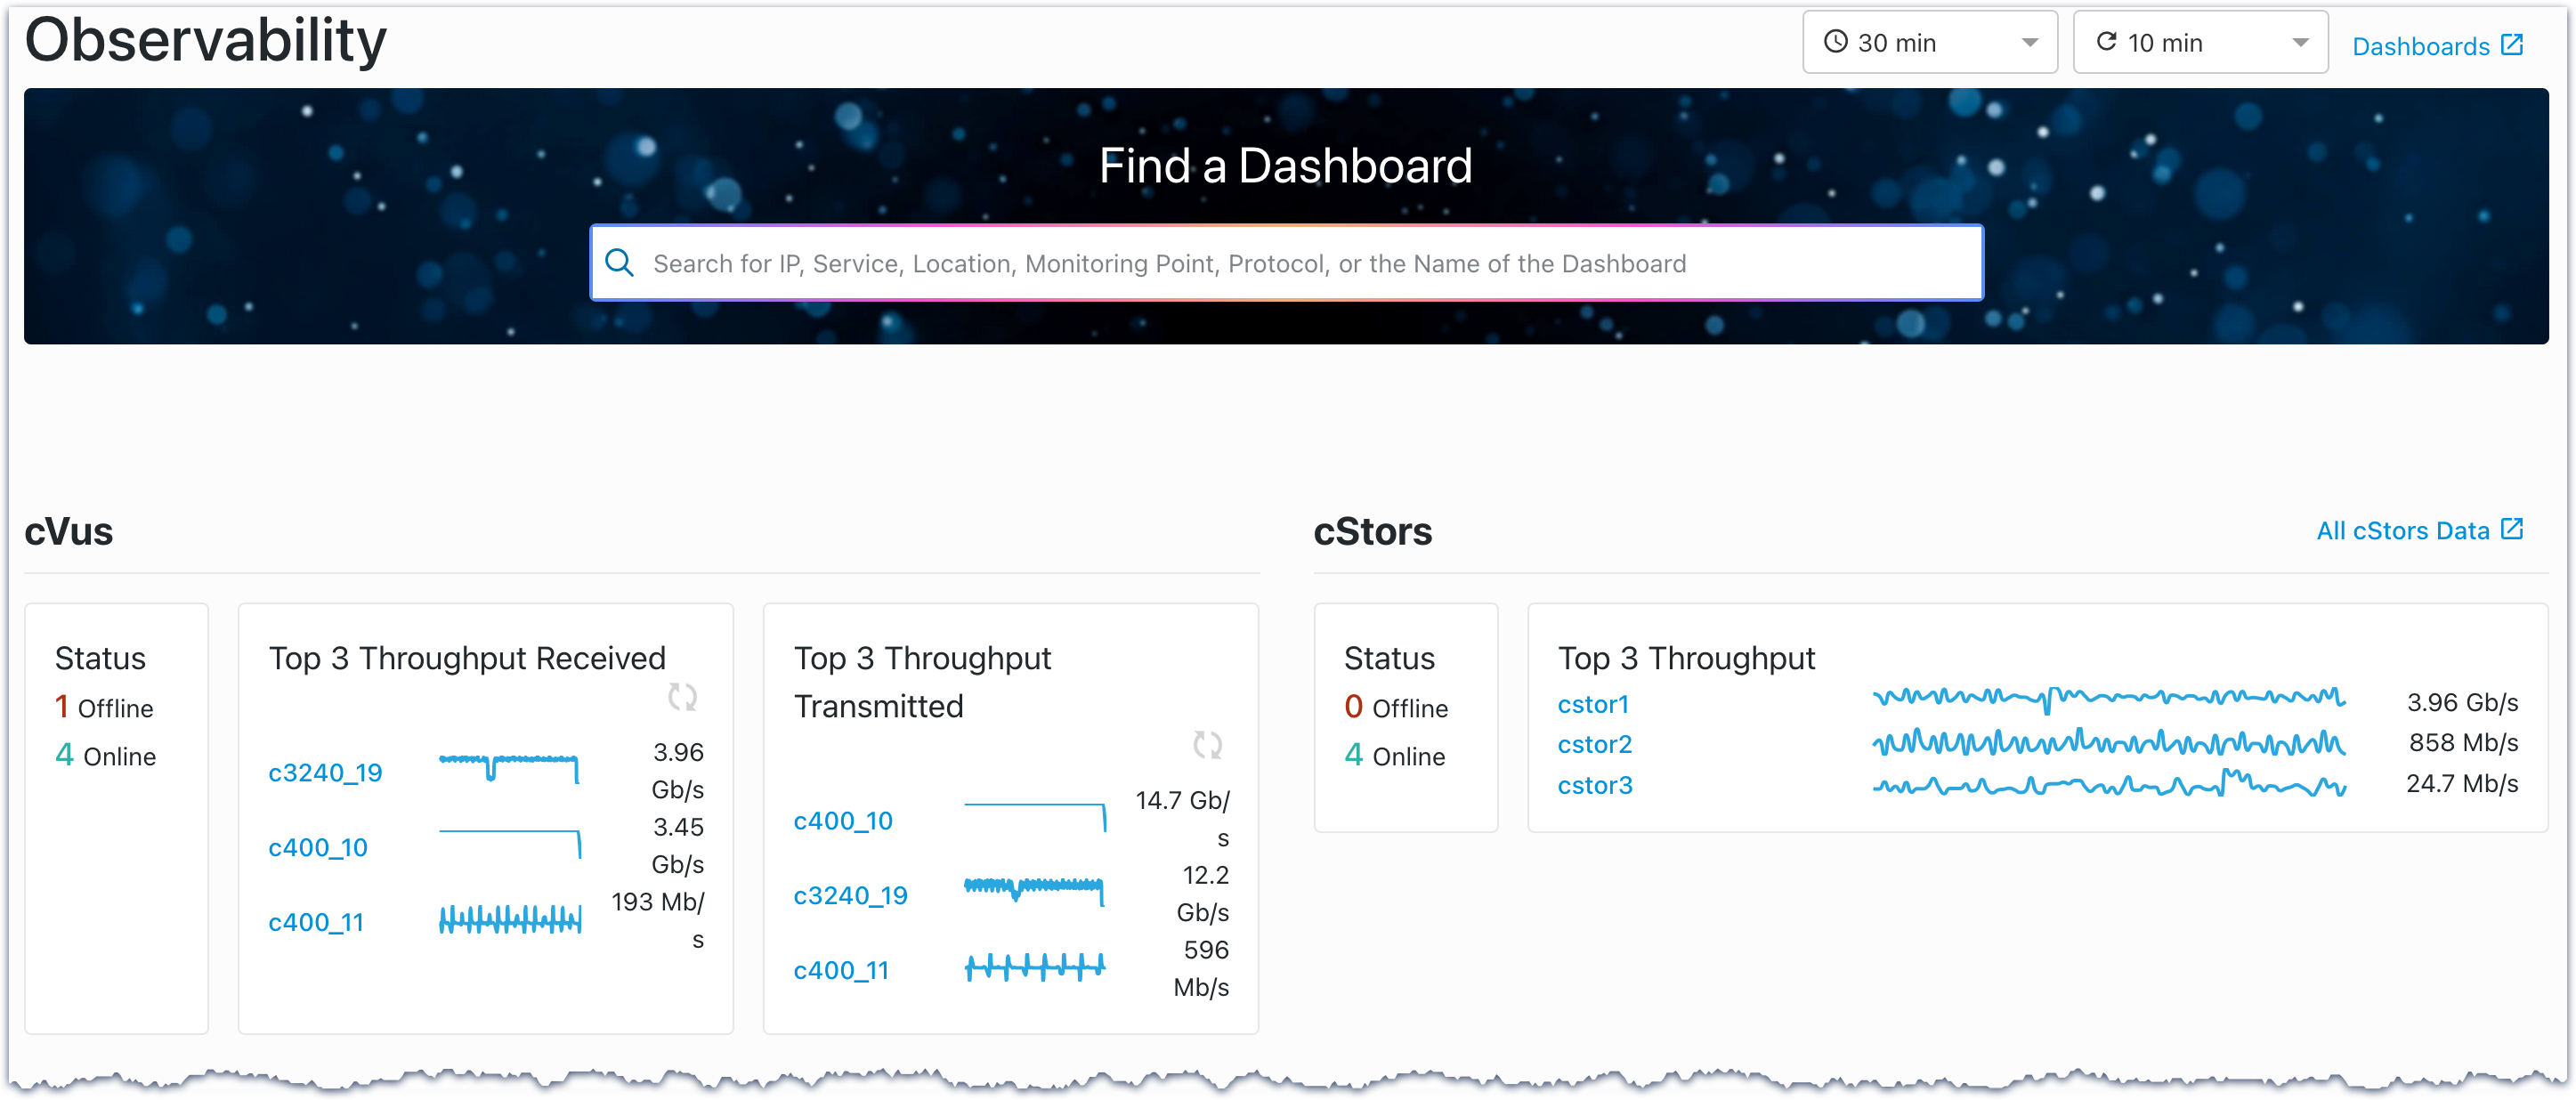
3.1. Find dashboards
Use the search field at the top of the Observability page to find and open dashboards. You can search by service, location, monitoring point, protocol, or dashboard name, including those marked as favorites. Favorites are indicated by a star icon in Grafana.
When you click in the search field, available filters and recently visited dashboards appear. You can type directly or select a filter to narrow the results. Select a result to open the corresponding dashboard.
3.2. Time range and refresh behavior
The Observability page uses a global time range and refresh rate that apply to all panels on the page.
Time range
The time range defines the window of data displayed across all panels. All panels respect the selected time range, which makes it easier to compare metrics and interpret trends consistently.
When you change the time range on the Observability page, the selected time range persists when you open dashboards from this page.
Refresh rate
The refresh rate controls how often the page automatically updates by rerunning queries against the data source. At each refresh interval, the system updates all panels using the current time range.
3.3. How observability data is organized
The Observability page organizes data by devices and by analytics labels. Each section groups traffic based on a specific label type, providing different perspectives on the same underlying traffic.
Device metrics
cVu and cStor sections appear at the top of the page and provide device-level visibility. These sections show throughput and status metrics that help you understand the health and capacity of the underlying infrastructure.
Device metrics are independent of analytics labels. To display device metrics, devices must be connected and have metrics collection enabled.
Analytics label metrics
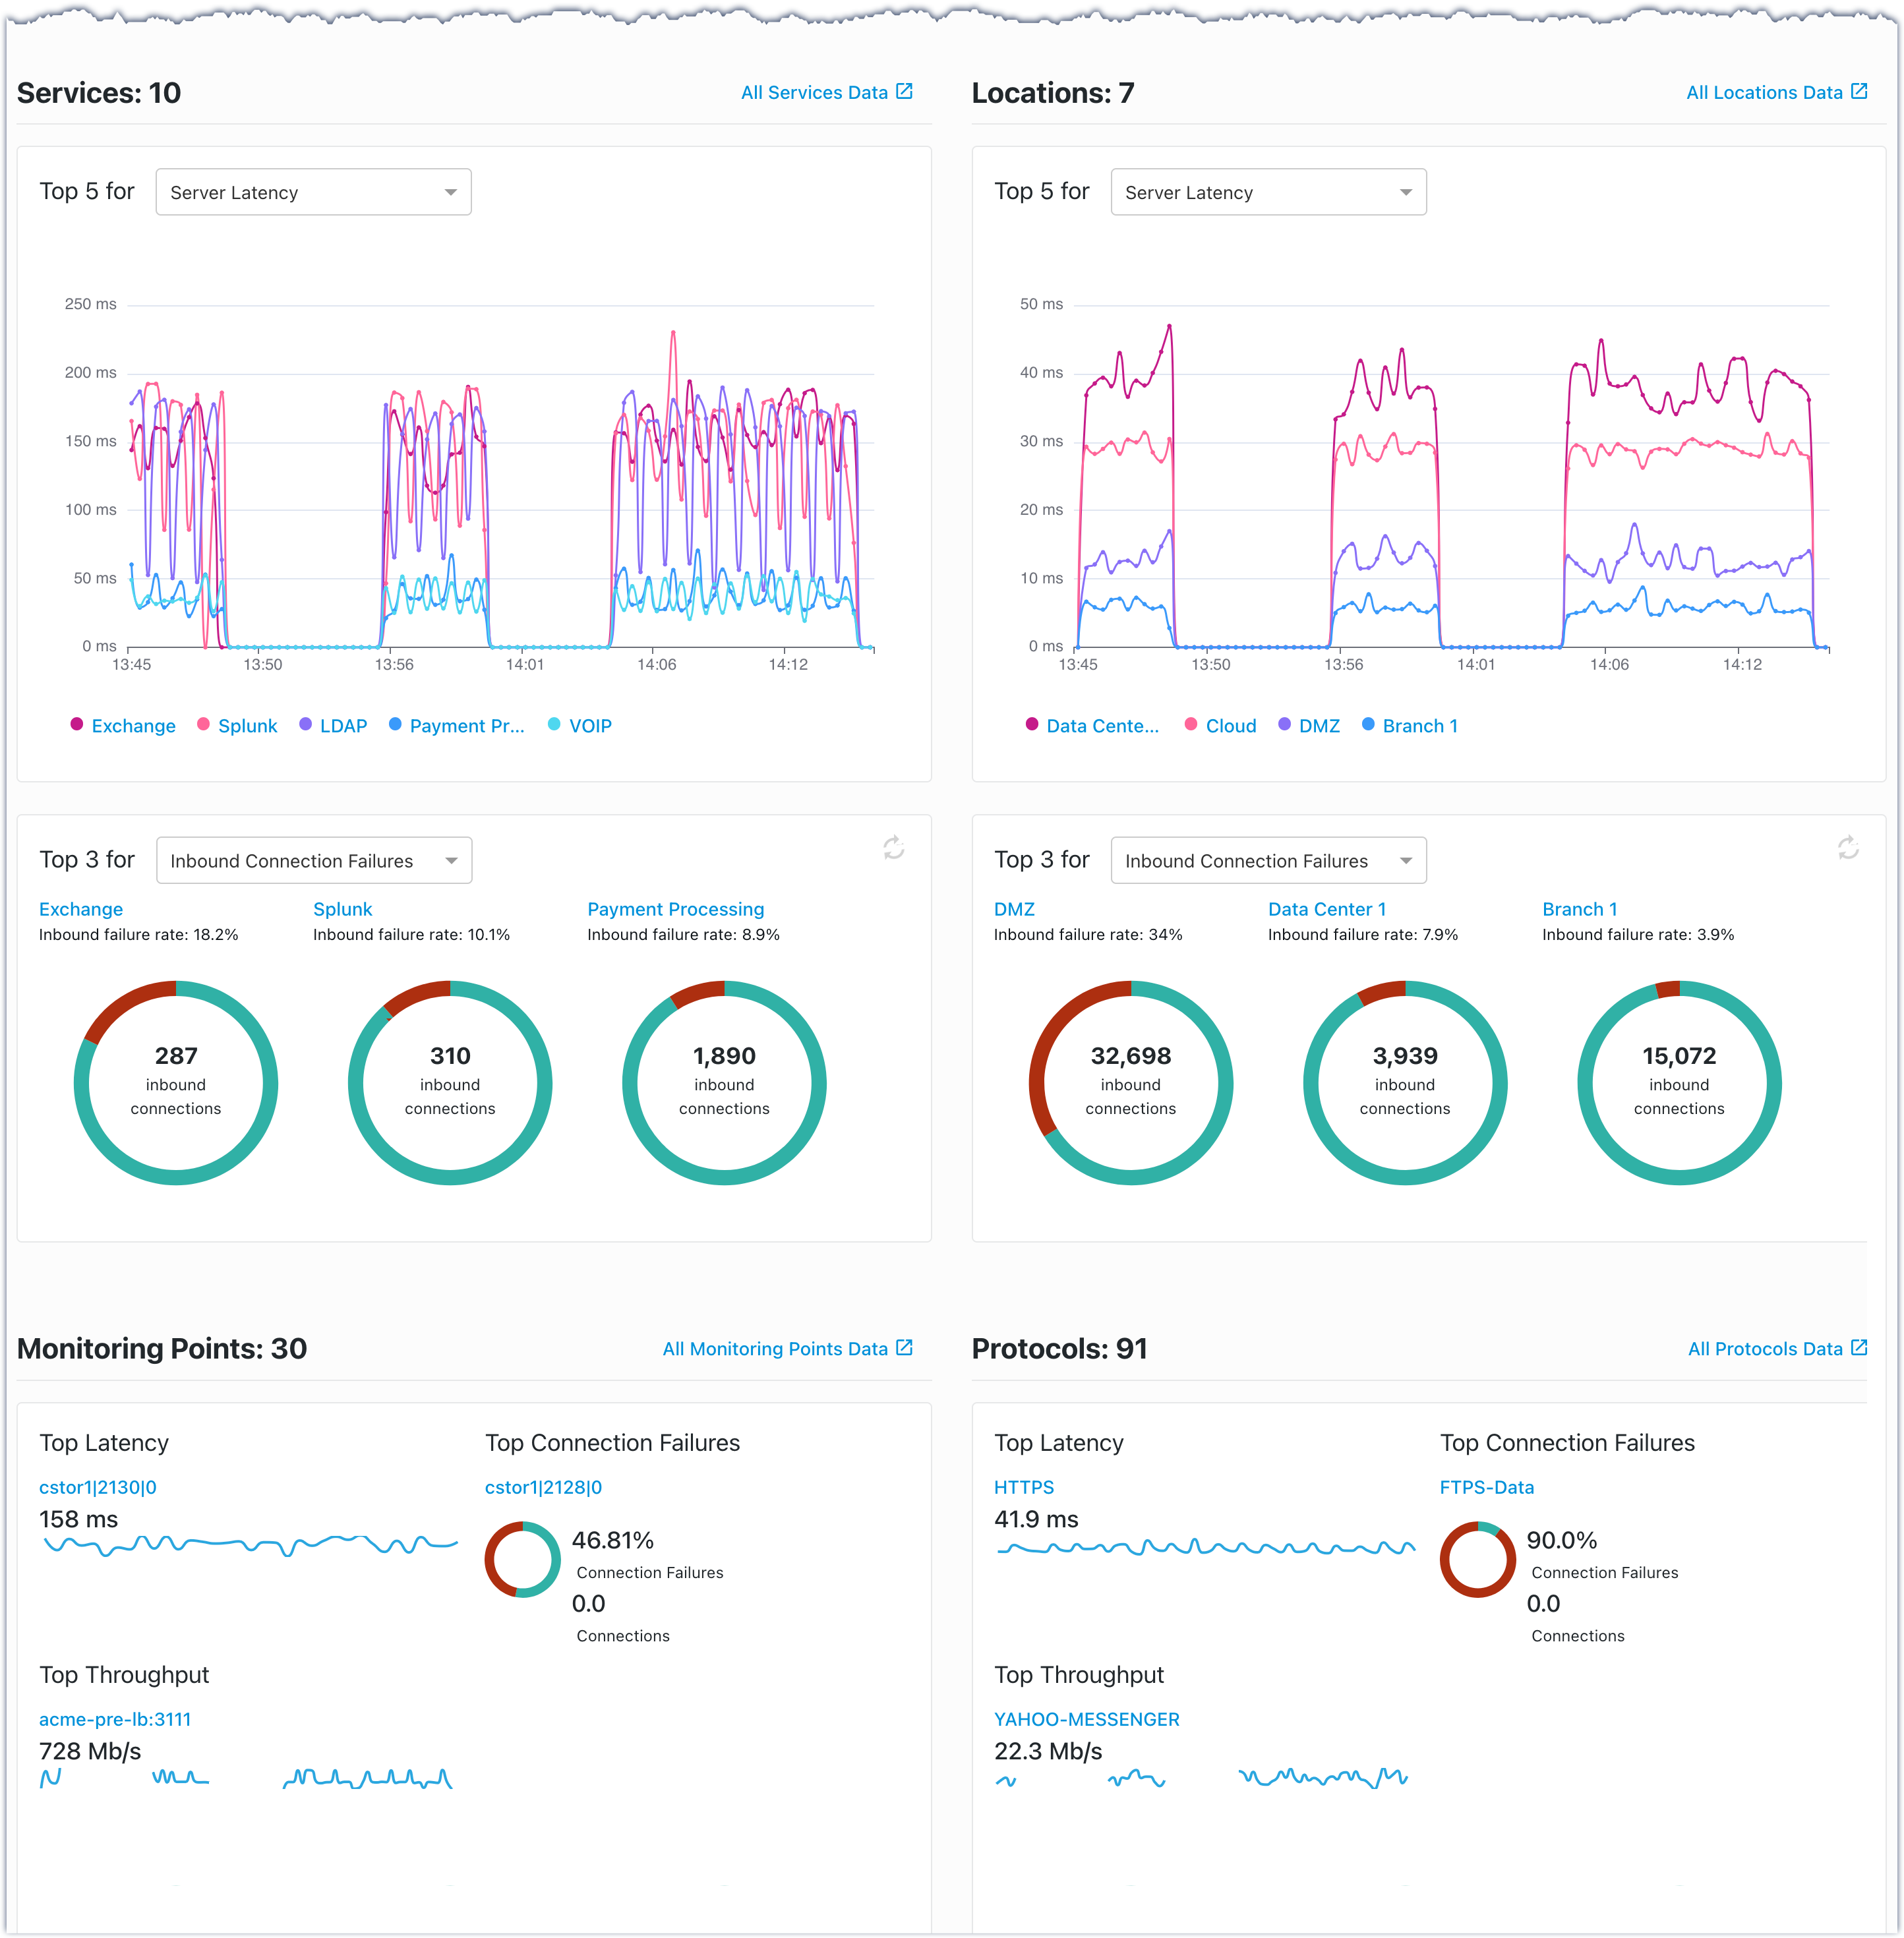
The remaining sections organize the same underlying traffic data into different groupings for analysis. Each section presents traffic from a different perspective, such as services, locations, monitoring points, or protocols.
Services and Locations group traffic using analytics labels. Default IP address type groupings are always applied. When custom labels are defined, they take precedence. Traffic that does not match a custom label is grouped under the default IP address types. For the complete list, see Default IP types in Configure analytics labels for network observability.
Monitoring Points group traffic based on where traffic is observed. When custom labels aren't defined, monitoring points default to the cStor device name and associated VLAN information.
The Protocols section groups traffic by protocol. Default transport and other protocol groupings are available. You can also define custom protocols. For TCP and UDP defaults, see Default TCP protocols and Default UDP protocols.
3.4. Data availability
The Observability page reflects the current configuration of your environment. Data, controls, and search results are available only after required components are configured.
Required configuration
To display cVu and cStor metrics, you must connect devices and enable metrics collection for each device. The cVu and cStor device dashboards require a separate import step before they are available.
To display observability data for Services, Locations, Monitoring Points, and Protocols, you must connect at least one cStor device and create and enable a network monitor. Until these steps are complete, analytics label sections may be unavailable.
User permissions
You must have dashboards permission enabled to view this page. For more information, see Manage user groups in the cClear User Guide.
3.5. Understand section data
Each section displays the top results based on session activity for the selected time range. Metric values represent averages calculated over that period.
Device sections summarize throughput and status for cVu and cStor devices. Analytics label sections summarize traffic grouped by Services, Locations, Monitoring Points, or Protocols.
For details on the dashboards, see Observability dashboards.
Default metrics and ranking
Each panel displays results ranked by the selected metric. The default metrics are:
cVus: Status, top 3 by throughput received, and top 3 by throughput transmitted
cStors: Status and top 3 by throughput
Services and Locations: Top 5 by server latency and top 3 by inbound connection failures
Monitoring Points and Protocols: Top results for latency, connection failures, and throughput
Metric selectors
Some panels include a metric selector dropdown that changes which results appear and how they're ranked. The Services and Locations sections allow you to select different metrics:
Latency panel: Server Latency as default, or Client Latency, or Network Latency
Connection failures panel: Inbound Connection Failures as default, or Outbound Connection Failures
Changing the selected metric changes how data is evaluated and ranked within the panel but does not change the underlying data source.
3.6. Navigate to dashboards
Links on the Observability page open related Grafana dashboards in a new browser tab.
Device links
cVu device names open the cVu Metrics dashboard for that device
cStor device names open the cStor Capture Performance dashboard for that device
All cStors Data opens the cStor Capture Performance dashboard for all cStor devices
Section overview links
All Services Data opens the All Services dashboard
All Locations Data opens the All Locations dashboard
All Monitoring Points Data opens the All Monitoring Points dashboard
All Protocols Data opens the All Protocols dashboard
Analytics label links
Label names are clickable and open Detail dashboards scoped to that specific label. For example, clicking Exchange in the Services section opens the Service Detail dashboard with Exchange pre-selected for analysis. This applies to all label types: services, locations, monitoring points, and protocols.
3.7. Related configuration and setup
For observability-related configuration tasks, see the following sections: