4.1. Dashboard layout and components
Observability dashboards provide multiple ways to view and analyze network activity depending on the selected dashboard type. Although available panels and actions vary by dashboard type, the dashboards include common controls and components for navigation, filtering, and interacting with data.
The following example shows common dashboard components.
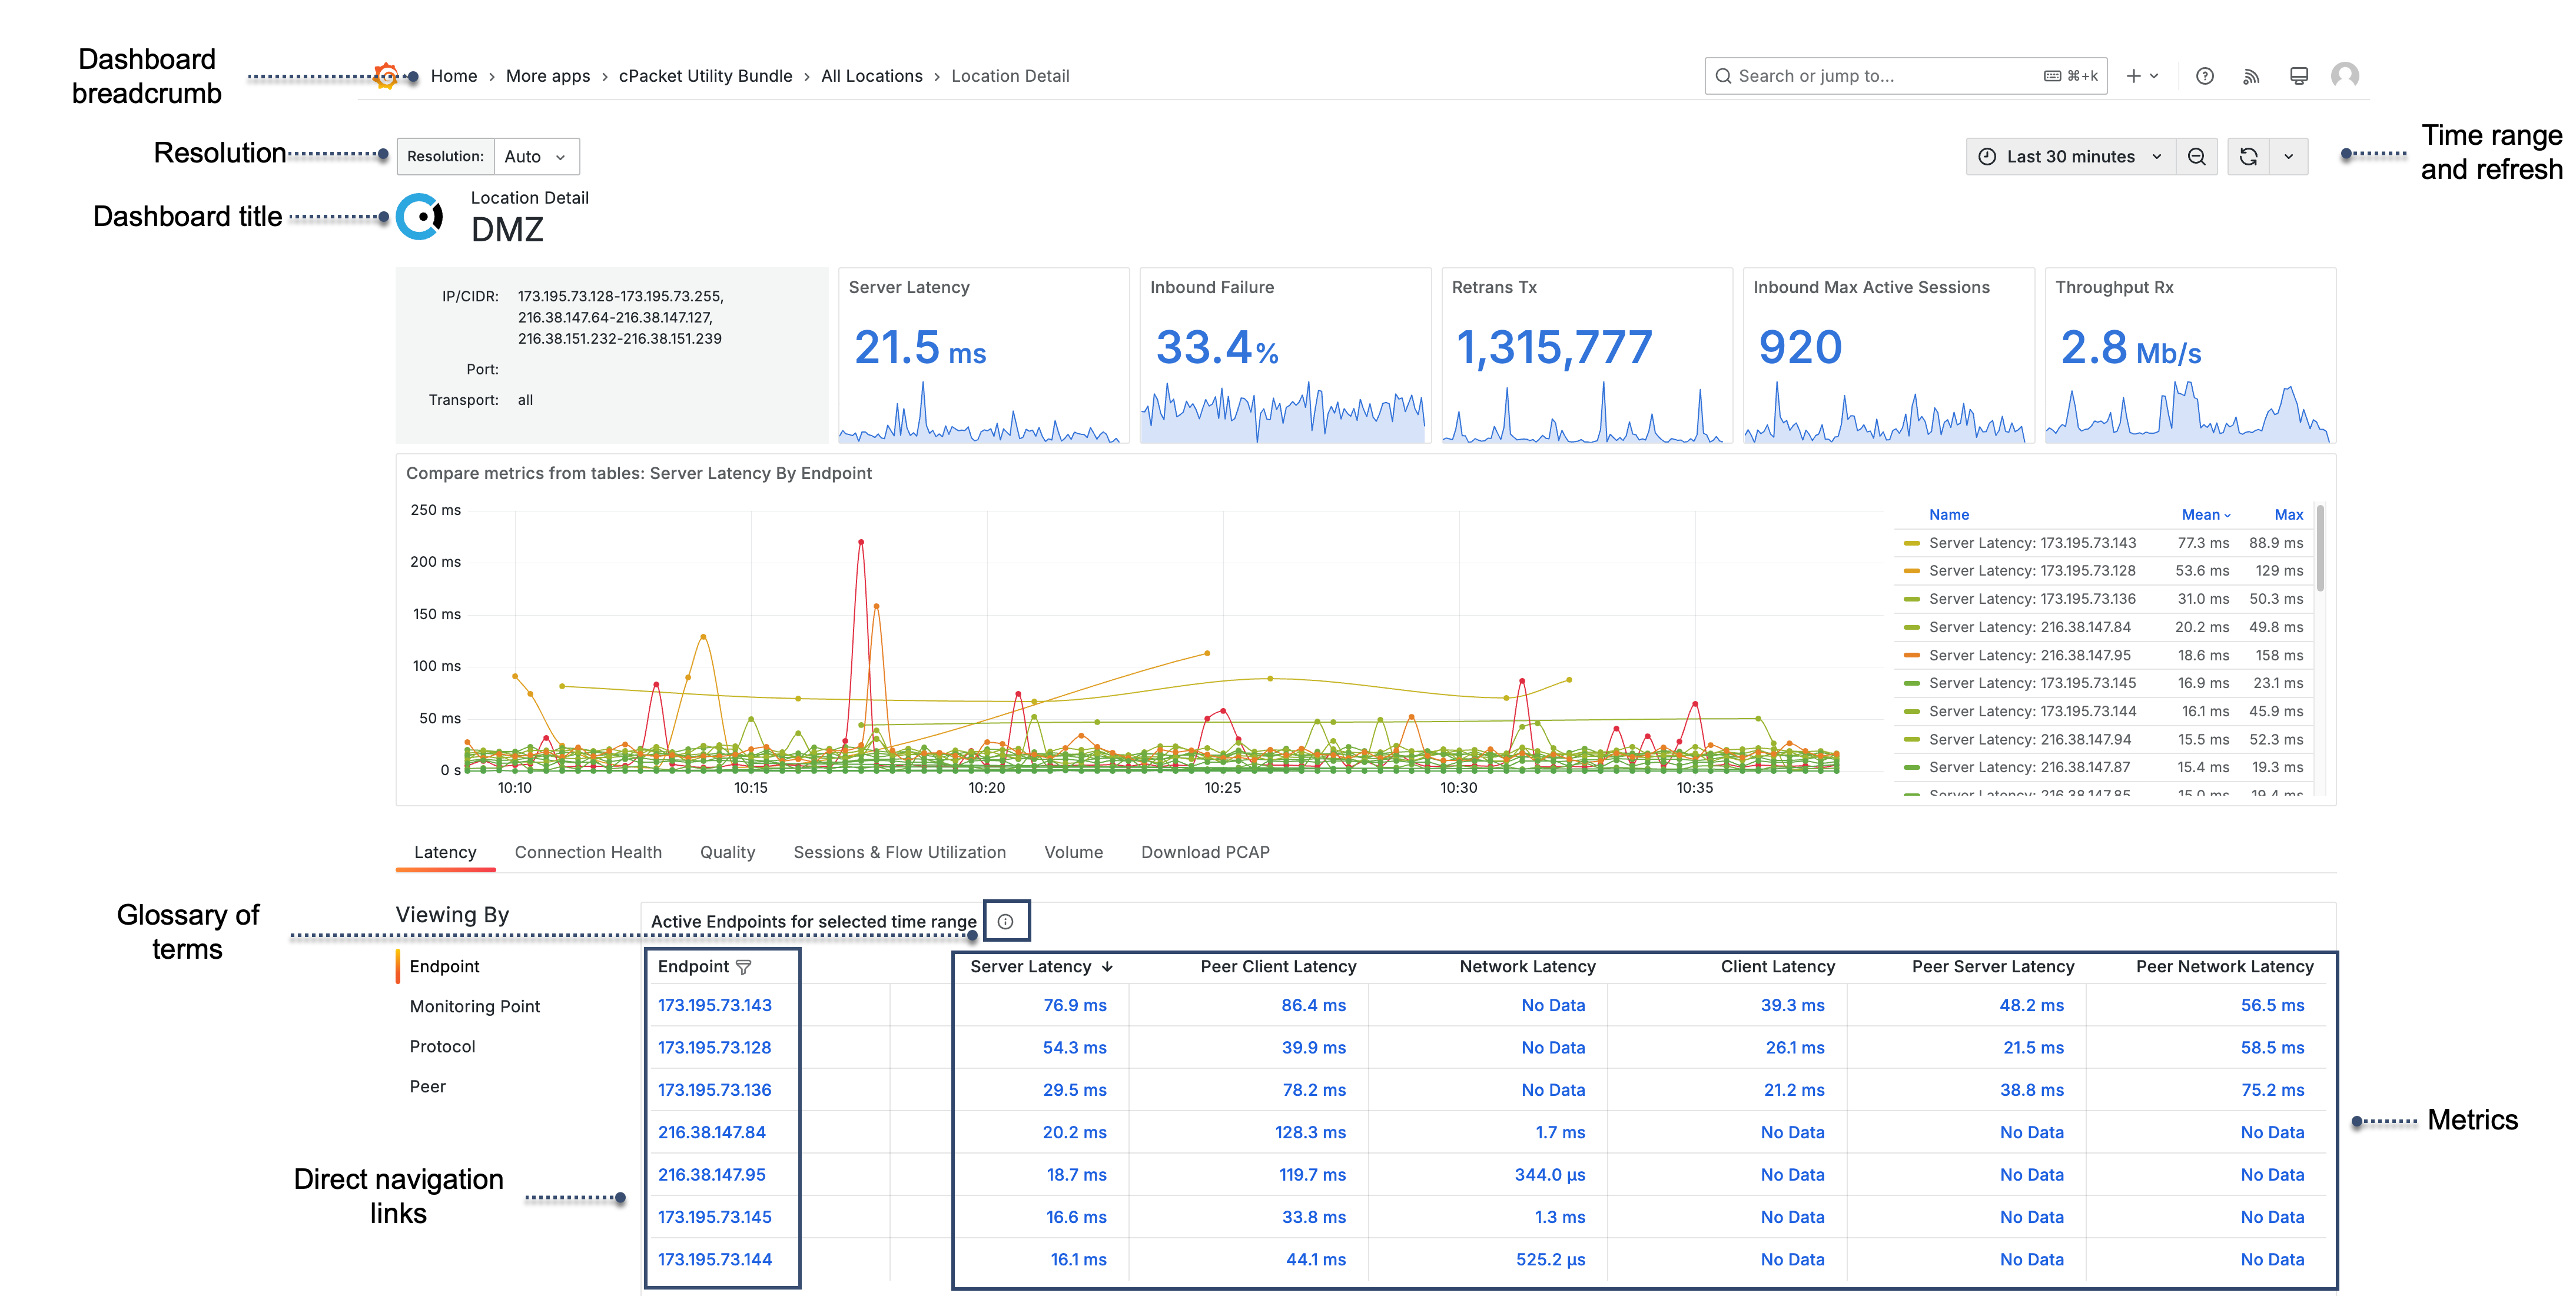
- Dashboard breadcrumb
Displays the current dashboard type.
- Resolution
All dashboards have a resolution variable that controls the granularity of time-series queries. Higher resolution provides more detailed data points.
- Dashboard title
Identifies the subject of the dashboard, such as the selected service, location, monitoring point, protocol, or endpoint.
- Time range and refresh
The time range selector defines the window of data displayed across all panels. The refresh control updates data automatically at specified intervals or manually on demand.
- Glossary of terms
Select information
 next to the table title to open the glossary of terms.
- Direct navigation links
Linked values in the table open related dashboards.
- Metrics
Metrics are data points tracked over time and displayed in the table.