4.3.6. Set the time range
Each dashboard includes a time range selector that determines the period displayed. All panels use the same time range, which allows you to compare metrics across the dashboard.
The time range selector is located in the top right corner of the dashboard navigation bar. By default, cPacket dashboards are designed to display data for the last 30 minutes. You can use the time range selector to override the default setting for all charts and tables within a dashboard. Once you've selected a time interval, it will remain in effect until you intentionally change it or navigate to a new dashboard.
Change the current time range
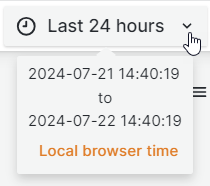
The current time range field displays the time range applied to the dashboard. Hover over the field to view the exact timestamps included in the range and the time source, such as the local browser time.
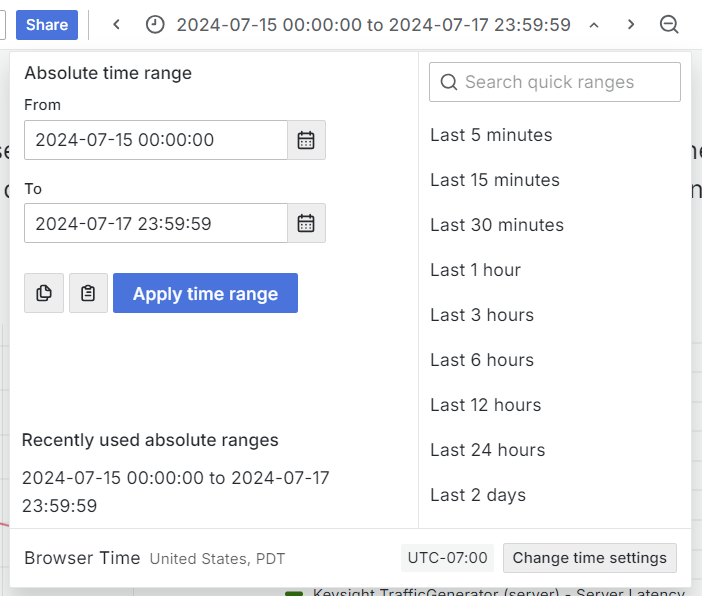
Select the current time range to open the time range selector. You can choose either a relative time range or an absolute time range, such as such as Last 15 minutes or 2024-07-15 00:00:00 to 2024-07-17 23:59:59.
 |
Specify a relative time range
Select a value from the Relative time ranges list. Use the search field at the top to filter the list. Some examples of time ranges include:
Last 30 minutes
Last 12 hours
Last 7 days
Yesterday
This day last week
Today so far
This month so far
Specify an absolute time range
You can specify an Absolute time range in three ways:
Type values in the From and To fields. You can type exact time values or relative values, such as
now-2h, and then select Apply time range.Select a date or date range from the calendar available next to the From or To fields, then select Apply time range.
Select a recently used absolute time range from the list.
Zoom in on a custom time range
To zoom in on specific metric activity, drag across a section of the graph. This creates a custom time range that is applied across the whole dashboard. Once you've selected a time range, it will remain in effect until you intentionally change it or navigate to a new dashboard.