5.3. Conversation dashboards
Conversation dashboards focus on interactions between two peers, such as endpoints, services, or locations. Use these dashboards to analyze traffic exchanged between the selected peers.
Dashboard structure
Each Conversation dashboard includes:
Conversation peers
Analytics collector panel
Time series graph
Metrics table
Conversation peers identify the two entities involved and provide context for the data being analyzed. The analytics collector panel allows you to fetch additional data for the selected conversation. The time series graph displays selected metrics over time for comparison and correlation. The metrics table presents detailed data organized by metric group.
Each dashboard opens with Server Latency as the metric displayed in the time series graph.
Metric groups
Metrics in the table are organized into predefined groups such as Latency, Connection Health, Quality, Sessions and Flow Utilization, and Volume. Select a tab to change the metrics shown. For a complete list of metrics in each group, see Metrics by group.
Table actions
Values in the table provide navigation and context-specific actions.
Direct navigation links
Open related Detail dashboards for the selected value, such as endpoint, peer, monitoring point, or protocol.
Data links
Allow you to add or change metrics in the time series graph for comparison. See Compare metrics in the graph.
The current context, including the selected time range, is preserved when navigating between dashboards.
Download PCAP
Use the Download PCAP tab to retrieve packet capture data for the selected conversation or time range. In the metrics table, the PCAP column provides a download action for each row. To learn more, see Download PCAP.
On-demand analytics collection
Use the Analytics collector panel to collect detailed analytics for a selected conversation.
If detailed analytics have not been collected for the selected time range, the panel prompts you to fetch additional data. If data is already available, the panel remains collapsed but accessible.
To retrieve detailed analytics, start a collection from the panel. The request gathers data from the selected sources and makes it available in the dashboard. See On-demand analytics collection.
Layout and components
The following example shows an Endpoint to Endpoint Conversation dashboard with its primary components.
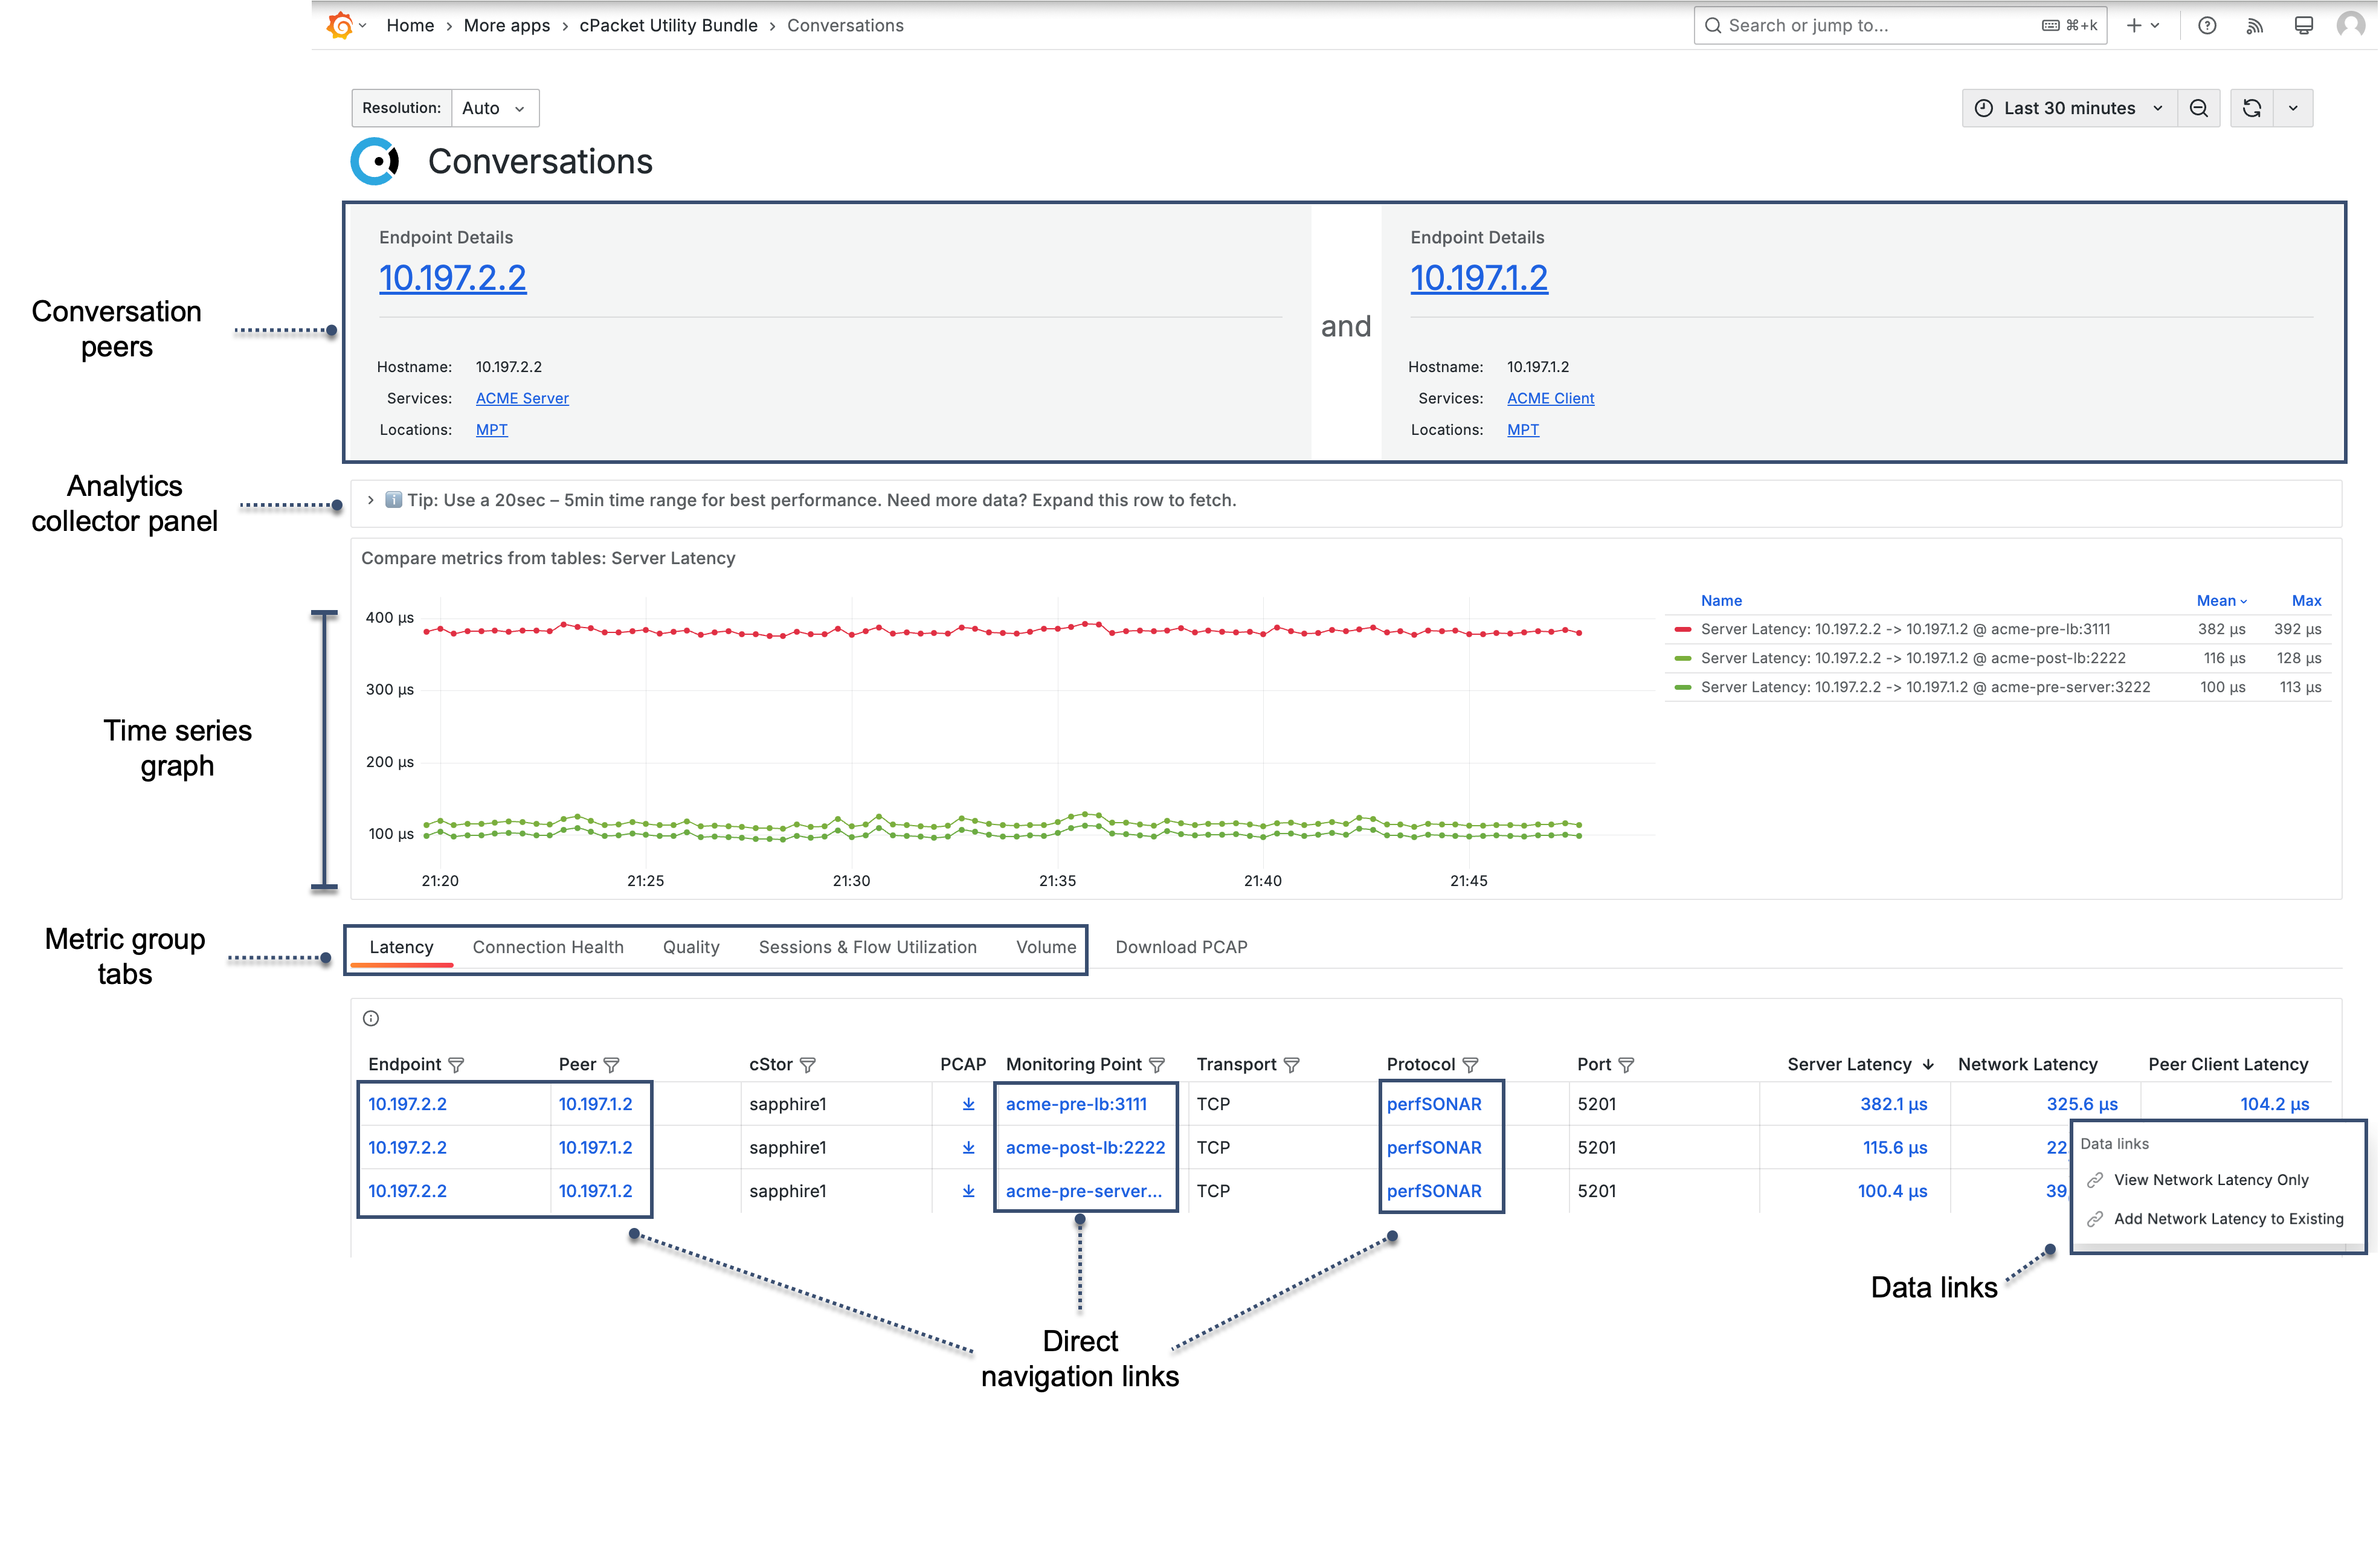
- Conversation peers
Identifies the two peers involved in the conversation, such as endpoints, services, or locations.
- Analytics collector panel
Provides controls to fetch additional data when detailed analytics are not available.
- Time series graph
Displays selected metrics over time for comparison and correlation.
- Metric group tabs
Metrics are organized into predefined groups, such as Latency, Connection Health, Quality, Sessions and Flow Utilization, and Volume. Selecting a tab changes the metrics shown in the table.
- Direct navigation links
Linked values in the table open related Detail dashboards.