5.4.3. On-demand analytics collection
Use the cPacket Analytics panel to collect detailed analytics. With one click, it sends the collection request, validates the parameter inputs, and checks the collection status.
Detailed analytics are used for troubleshooting. You can narrow your focus to a specific endpoint, conversation, and time window for deeper analysis, helping you quickly identify the source of network problems. Data is collected only when requested to prevent overloading the database and increasing query load times. Specifically, data is collected from the selected cStors and written to the local database for dashboard queries.
The cPacket Analytics panel appears in the following contexts:
Endpoint Detail dashboard when viewed by peer. It does not appear on other detail dashboards or in other views within the Endpoint Detail dashboard.
Conversation dashboards.
The panel expands automatically when no analytics data is available for the selected time range, prompting you to run a collection. When any analytics data already exists for the selected time range, the panel collapses but remains accessible. To run an additional collection, expand the No data or partial data? Fetch analytics row.
 |
Caution
Large time ranges can result in long collection times and may cause timeouts or system issues. The recommended time range is between 20 seconds and 5 minutes.
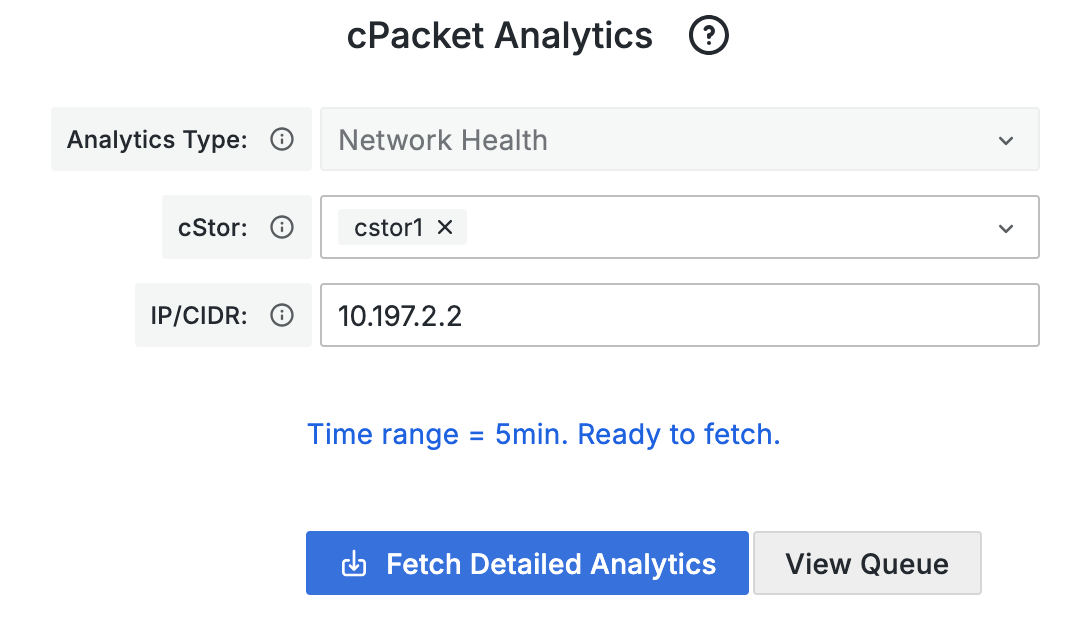
To retrieve detailed analytics, run the cPacket Analytics on-demand collector. Different types of analytics data can be collected according to your area of interest.
Parameter | Function |
|---|---|
Time range | The recommended time range is between 20 seconds and 5 minutes. If you select a time range longer than 5 minutes, you are prompted to confirm before proceeding. You can adjust the time range using the selector in the top right corner of the dashboard. |
Analytics type | Automatically populated based on the dashboard context. This field is read-only and cannot be changed. |
cStor | The list of cStors comes from the network monitor set in cClear. |
IP/CIDR | The IP or CIDR used to collect analytics from the specified network monitor and is automatically populated. You can enter an IP/CIDR of interest, which must be a subset of or intersect with the network monitor's CIDR. |
To collect analytics, click Fetch Detailed Analytics in the cPacket Analytics panel. The system sends a request every 2 seconds and displays the collection status. A timer shows the duration.
Once complete, a message shows the time taken and whether the process succeeded with data or failed, including any exception details. If the fetch is successful, the dashboard automatically populates with the collected data.
To view the status of active and pending analytics collection jobs, click View Queue.