5.3. Two-subject dashboards
Two-subject dashboards focus on traffic that matches two selected dashboard subjects, providing metrics for traffic that matches both subjects. Dashboard subjects include services, locations, monitoring points, protocols, and endpoints. Use these dashboards to narrow your analysis while retaining the current Detail dashboard subject.
Seven subject combinations are supported, with a dashboard for each subject order, such as Service + Protocol and Protocol + Service, for a total of 14 Two-subject dashboards. The supported subject combinations are:
Service + Monitoring Point
Service + Protocol
Location + Monitoring Point
Location + Protocol
Monitoring Point + Protocol
Monitoring Point + Endpoint
Protocol + Endpoint
The subject order reflects the Detail dashboard from which you drilled down and is shown in the breadcrumb and dashboard title. For example, Service + Protocol indicates that you drilled down from a Service Detail dashboard, while Protocol + Service indicates that you drilled down from a Protocol Detail dashboard. Both dashboards analyze traffic that matches the same selected service and protocol.
Dashboard structure
Each Two-subject dashboard includes:
Dashboard subject definitions
Time series graph
Metrics table
Layout and components
The following example shows a Service + Monitoring Point Two-subject dashboard with its primary components.
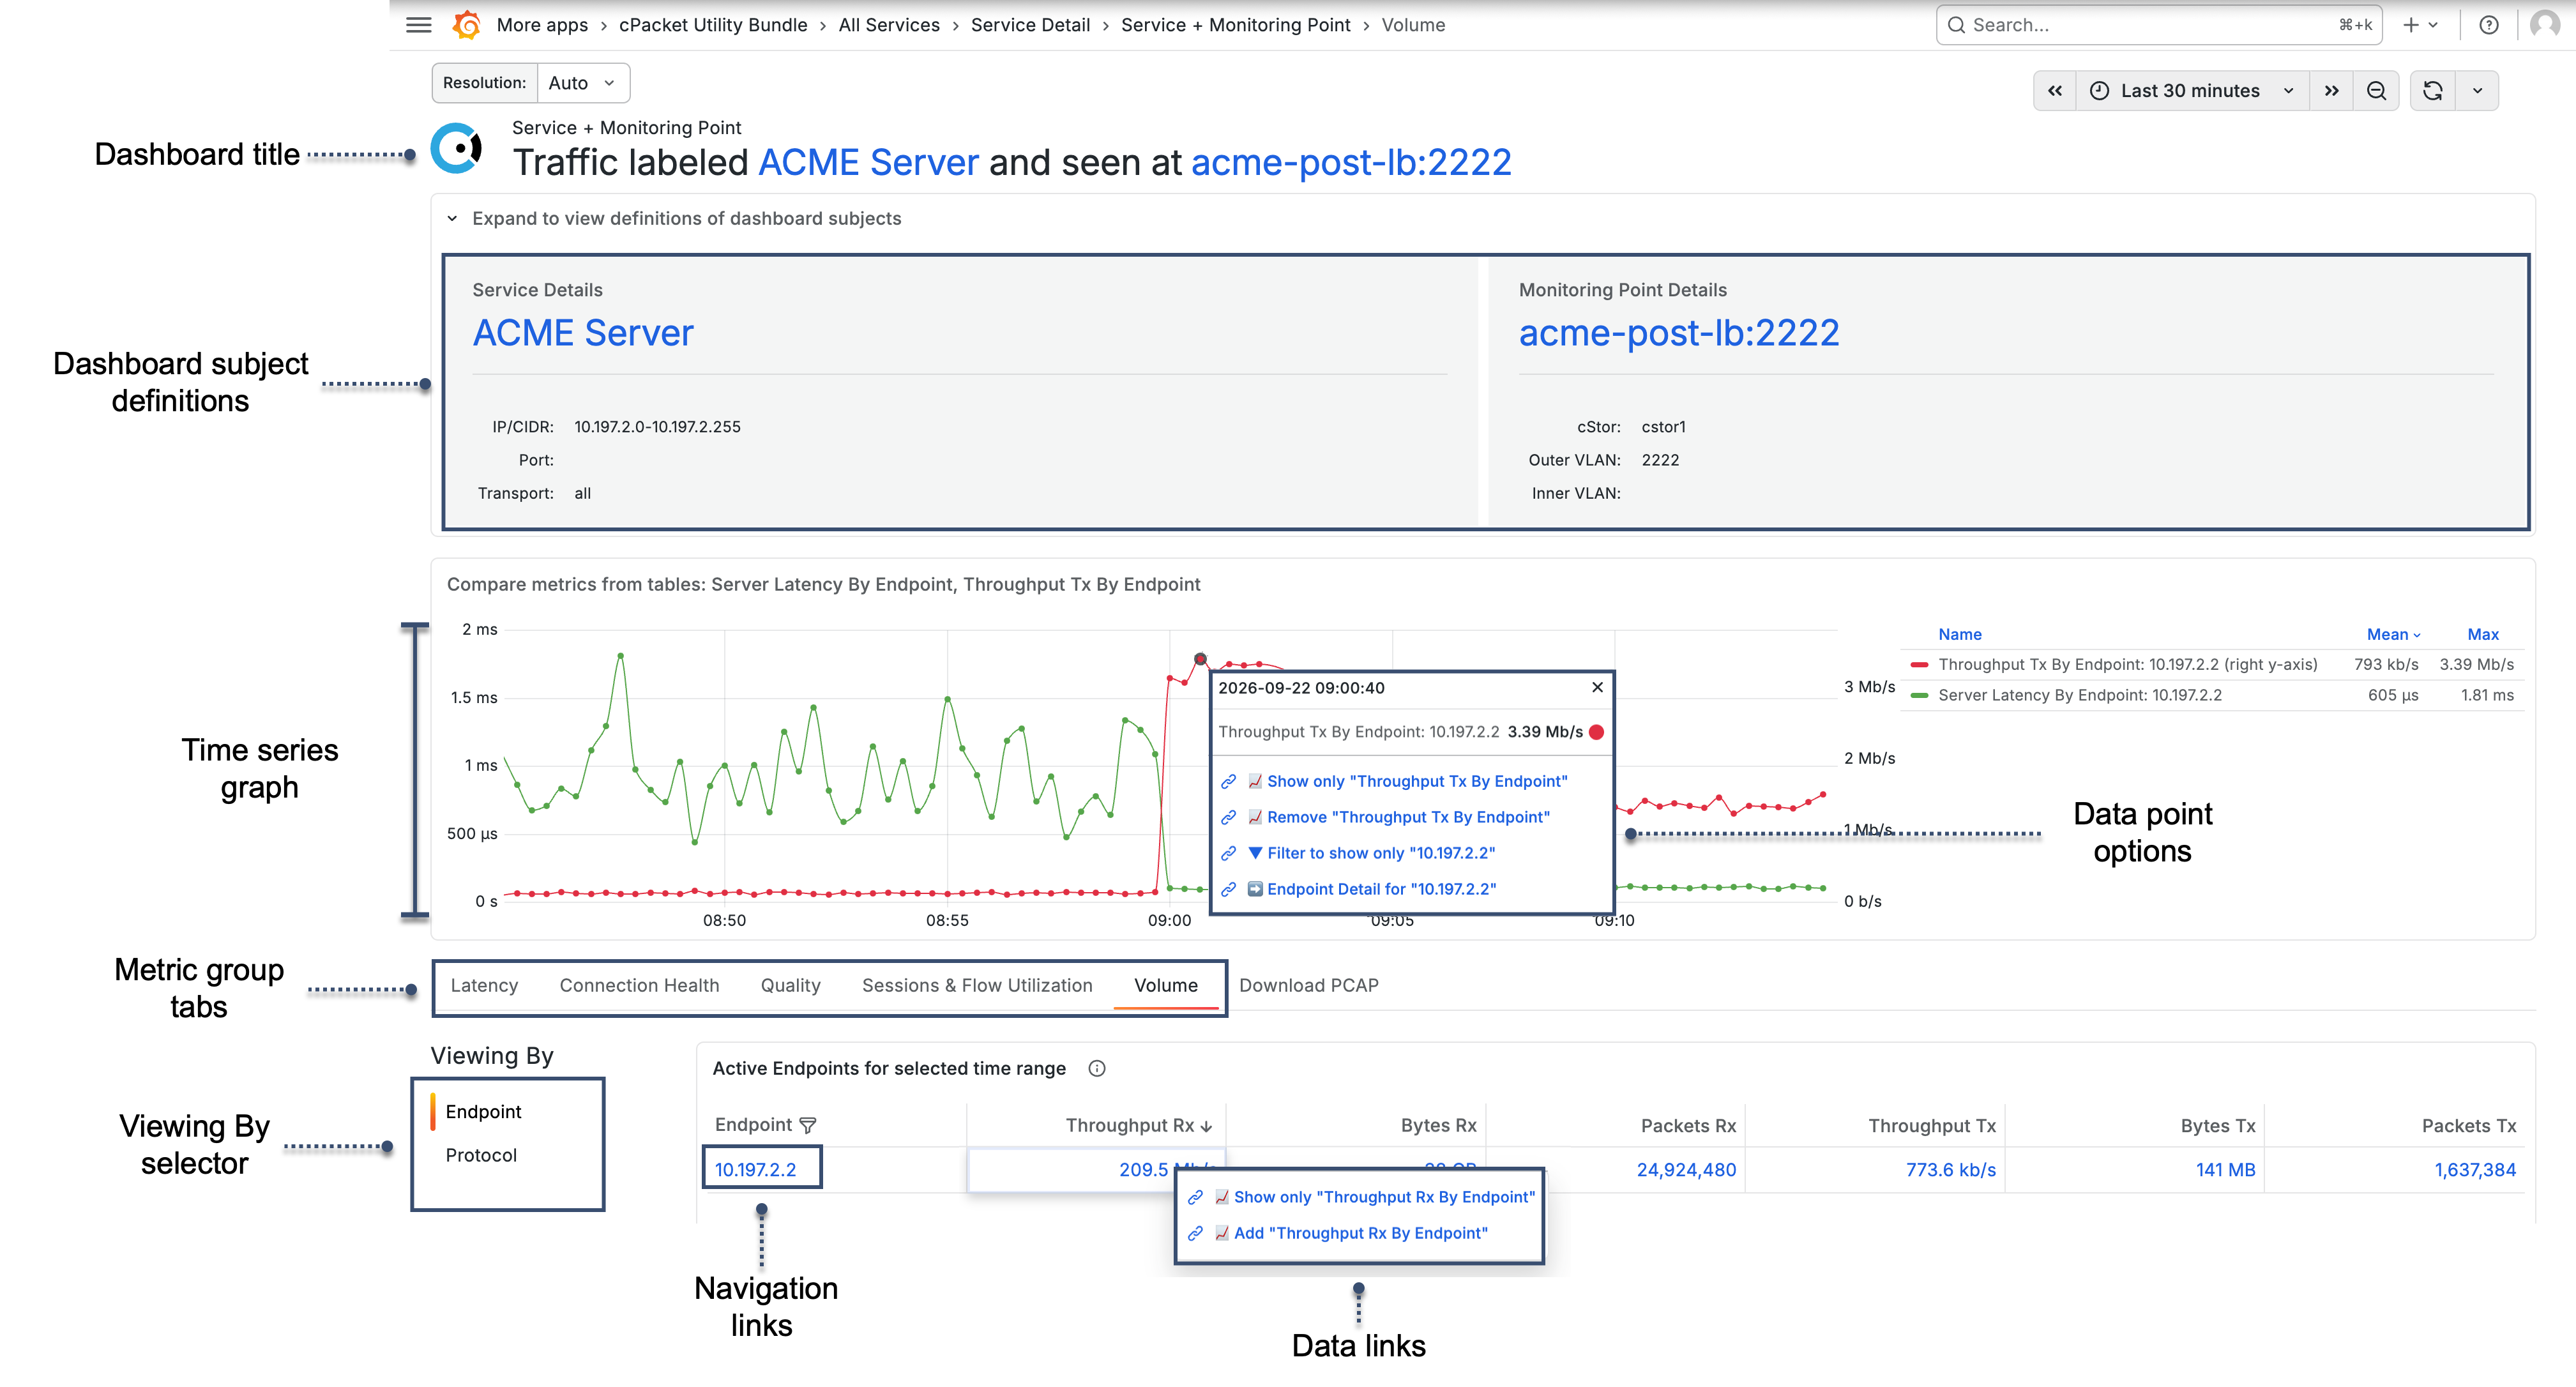
- Dashboard title
Identifies the two subjects that define the dashboard scope. The subject order reflects the Detail dashboard from which you drilled down. Select a linked subject to open its Detail dashboard.
- Dashboard subject definitions
Displays identifying information for the two subjects being analyzed. Expand the section to view information such as IP addresses, ports, transport protocols, VLAN settings, hostname information, or associated services and locations. Select the linked subject to open its Detail dashboard.
If you do not have sufficient permissions, this section displays a message indicating that cClear analytics > read permissions or higher is required.
- Time series graph
Displays selected metrics over time for comparison and correlation.
Two-subject dashboards initially display Server Latency in the time series graph.
Select a data point in the time series graph to access options for the selected metric and associated subject. Depending on the data point, you can show only or remove the selected metric, filter the graph to show only the associated subject, or open the associated subject's Detail dashboard.
- Metrics table
Displays detailed metrics for the selected time range, organized by metric group.
- Metric group tabs
Metrics are organized into predefined groups, such as Latency, Connection Health, Quality, Sessions & Flow Utilization, and Volume. Select a tab to change the metrics shown in the table. For a complete list of metrics in each group, see Metrics by group.
- Viewing By selector
Changes the perspective of the metrics in the table. Depending on the dashboards subjects, you can view the same data across different dimensions, such as endpoint, service, location, monitoring point, protocol, or peer. The two subjects that define the current dashboard are not available as Viewing By selections.
- Navigation links
Linked entries in the first column provide navigation to related Detail dashboards.
On Two-subject dashboards that support Peer, select a peer to navigate to an Endpoint Conversation dashboard or the selected peer's Detail dashboard. See Navigate to conversation dashboards.
The selected time range is preserved when navigating between dashboards.
- Data links
Select a metric value to show only that metric, add it to the time series graph, or remove it from the graph. See Change what the graph displays.
- Download PCAP
Use the Download PCAP tab to retrieve packet capture data for the current dashboard scope and selected time range. To learn more, see Download PCAP.