Zoom-out using breadcrumbs
The workflow breadcrumb displays the selected tag, metric name, and metric value from the preceding dashboard in the workflow. You can click on this metric to navigate back to the previous level, providing a way to move up the workflow hierarchy and take a more macro-level view of the data, helping you to understand the broader context and impacts.
Zoom-out navigation means you move from a detailed view back to a more general overview. For example, you might start by inspecting the metrics for a specific endpoint and then zoom out to see how it fits into the overall network. The breadcrumb trail located at the top of the dashboards acts as a roadmap of your session history, populating by carrying forward the context from the preceding dashboard in the workflow hierarchy.
In the following example, the Monitoring Point and Service by Endpoints dashboard, categorized as a Level 2 dashboard within the Explore Monitoring Points workflow, narrows the focus to the endpoint associated with the ACME pre_lb monitoring point and the service ACME Client.
By selecting the first breadcrumb, you can zoom out to the preceding Level 1 dashboard, which presents a broader view of all the services associated with the monitoring point ACME pre_lb. This action will navigate you to the Level 1 dashboard titled Monitoring Point by Services, offering a more generalized perspective.
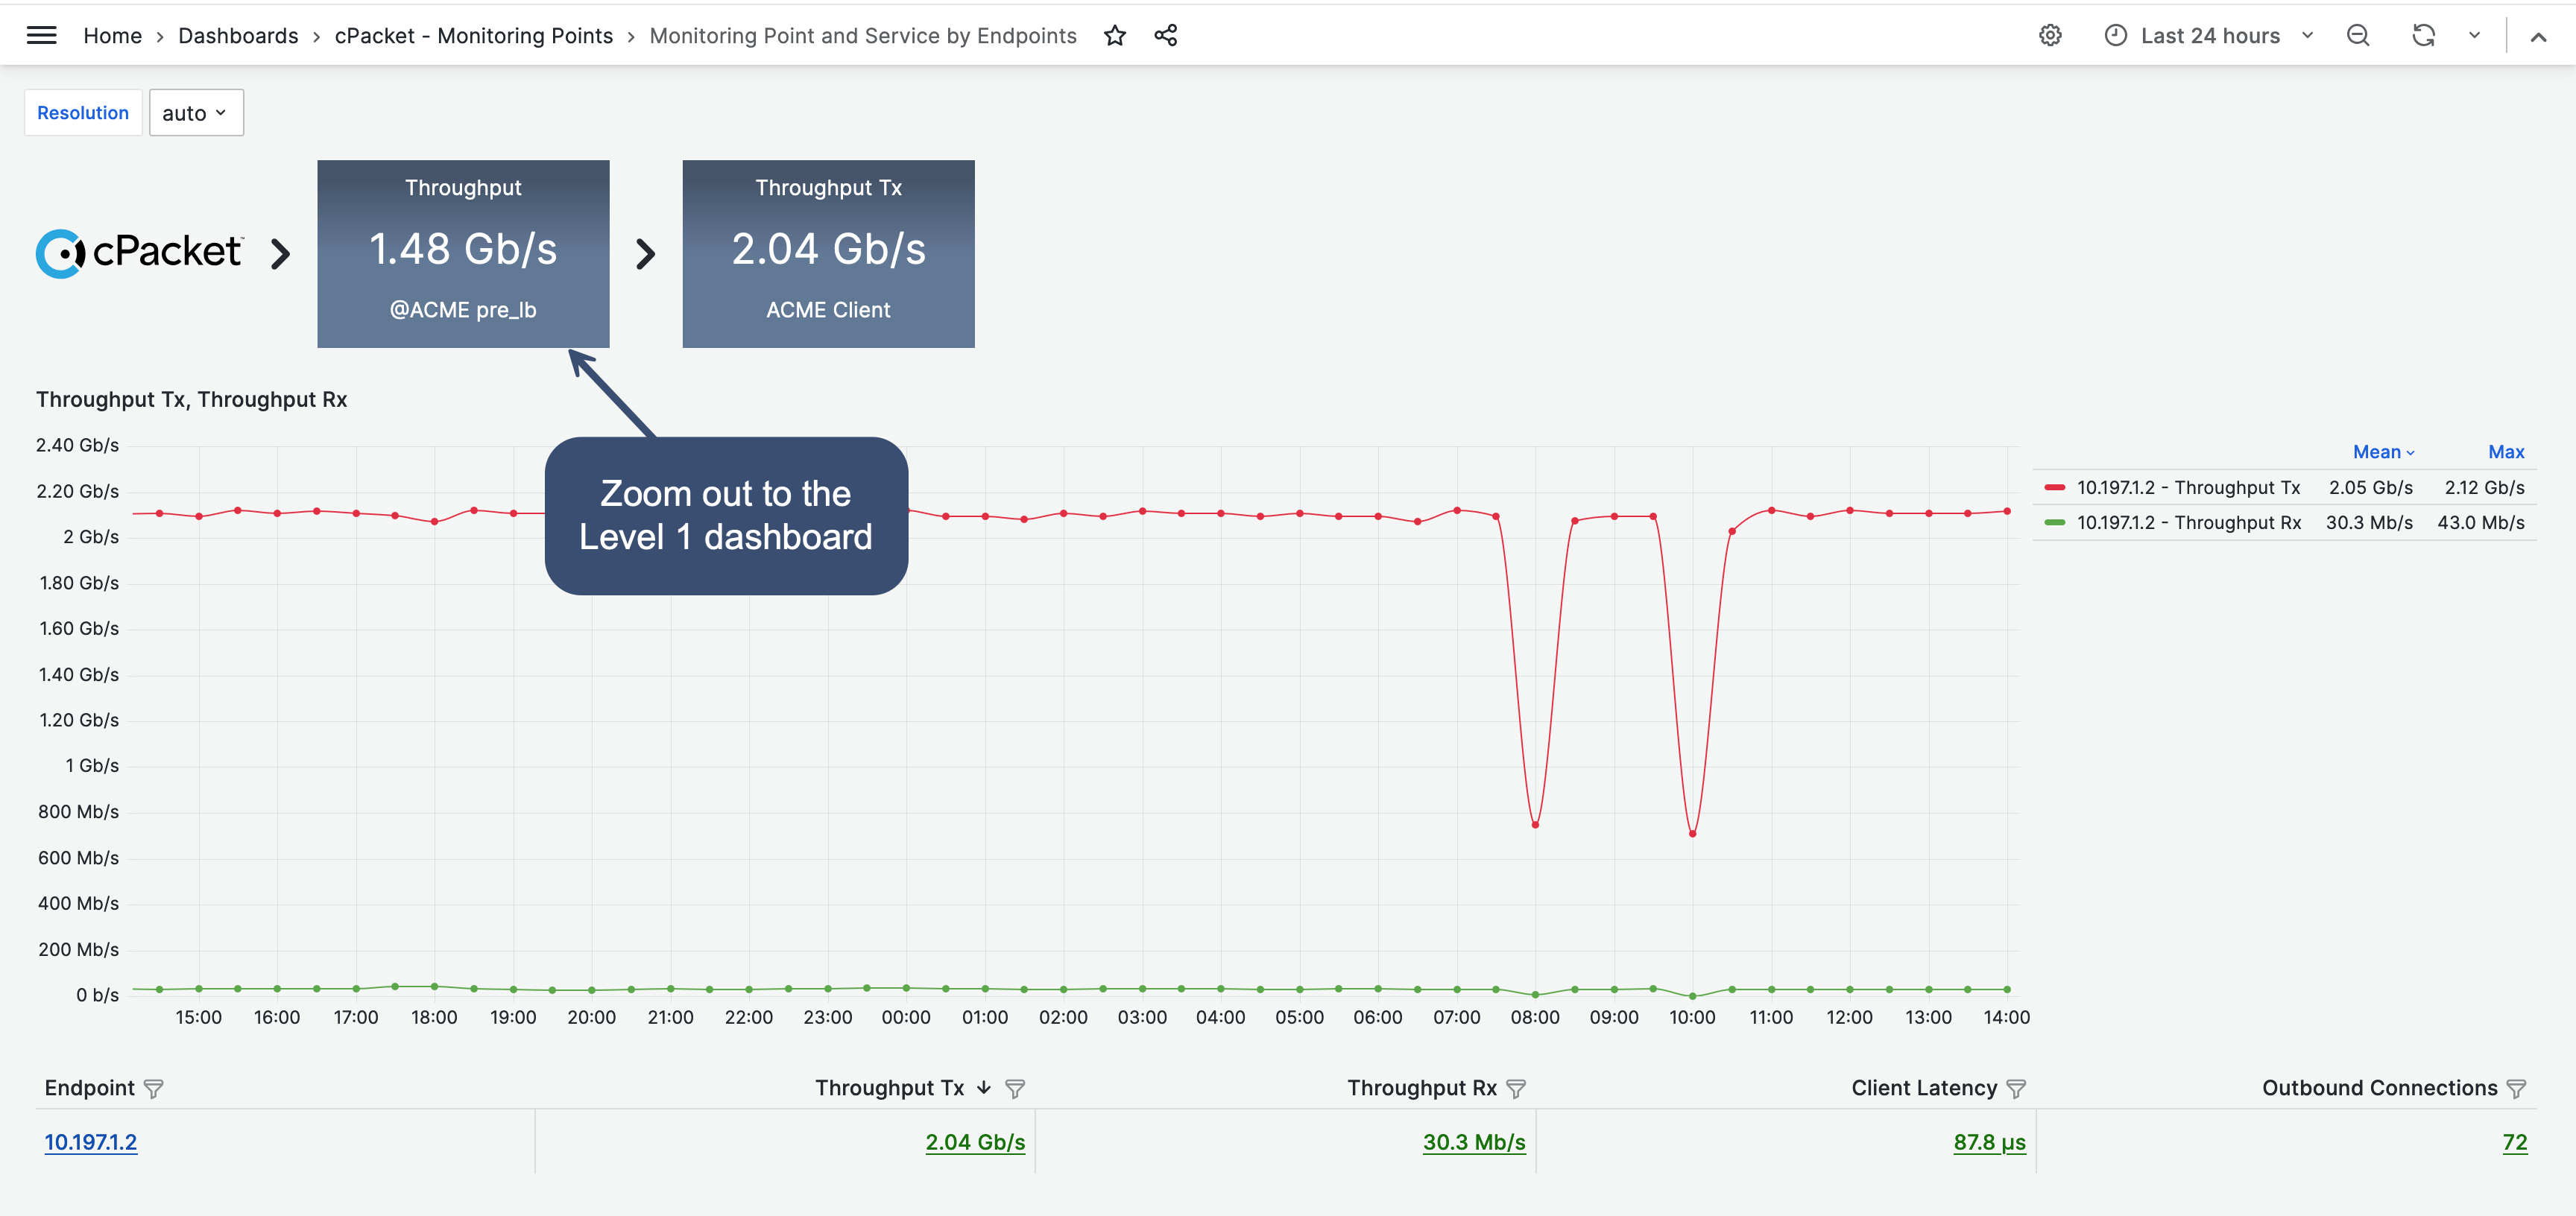
Use the breadcrumb to zoom out and return to the previous dashboard.
Breadcrumbs
The workflow breadcrumbs, located above the graph, indicate the path you took to arrive at the current dashboard. As you drill down, you can click on a breadcrumb to zoom out and return to a higher workflow level. Breadcrumbs are arranged in the order they appear within the workflow hierarchy, with the first level positioned farthest to the left.
The breadcrumbs are your navigational path and are populated based on your session history with the tag, metric, and value selected from the previous dashboard. The following is a detailed breakdown for each dashboard level:
Overview: This is the highest level in the hierarchy, where no breadcrumb is present. It's the starting point of your exploration.
Level 1: At this level, a breadcrumb appears based on the metric and tag selected from the Overview dashboard. This breadcrumb shows the previous context. Click this breadcrumb to go back to the Overview dashboard.
Level 2: A second breadcrumb is added, carrying context from the Level 1 dashboard, including tag, metric, and value. The first breadcrumb remains and is a link leading back to the Level 1 dashboard. Only the first breadcrumb functions as a link.
Level 3: The breadcrumb trail is reduced back to one, but this time, it displays the average value for the current metric and the main tag selected for the workflow, the service, location, monitoring point, or protocol. Click on the breadcrumb to return to Level 2.
Level 4: The Level 4 breadcrumb retains the same context as Level 3. Click on the breadcrumb to navigate back to Level 3.
Note
Occasionally, you might come across an empty breadcrumb. This happens when the data relating to the tag, metric, and value hasn't been transferred to the current dashboard. Here are a couple of instances where you can observe this:
Searching by IP address on the Observability page, which navigates you to the Level 3 dashboard.
Selecting client-based metrics from the Observability page.