Drill down using data links
The graph and the table contain identical links to drill down into the workflow. Drilling down is the process of moving from a more general view to a more detailed view. For example, you might start by looking at the overall performance metrics for all of your services and then drill down into a specific endpoint to inspect more detailed metrics.
The purpose of drilling down is to help you identify the root cause of any issues and understand the context and causes of your network's behavior, not just observe the behavior itself. The tags and data points in the graph serve as navigational targets to other dashboards. Click the tag or data point to display the data links available. Any data link above the dashed line --- is a dashboard you can navigate to. Data links dynamically transfer contextual information about the metadata you are viewing to the linked dashboard, such as the time range selected on the graph.
In the following example, the Monitoring Point by Services dashboard, categorized as a Level 1 dashboard within the Explore Monitoring Points workflow, focuses on the monitoring point ACME pre_lb and includes the services ACME Client and ACME Server, visible in the table's tag column.
Using the data links in either the table or graph, you can drill down to investigate the endpoints associated with the ACME pre_lb monitoring point and the service ACME Client. This option will navigate you to the Level 2 dashboard titled Monitoring Point and Service by Endpoints.
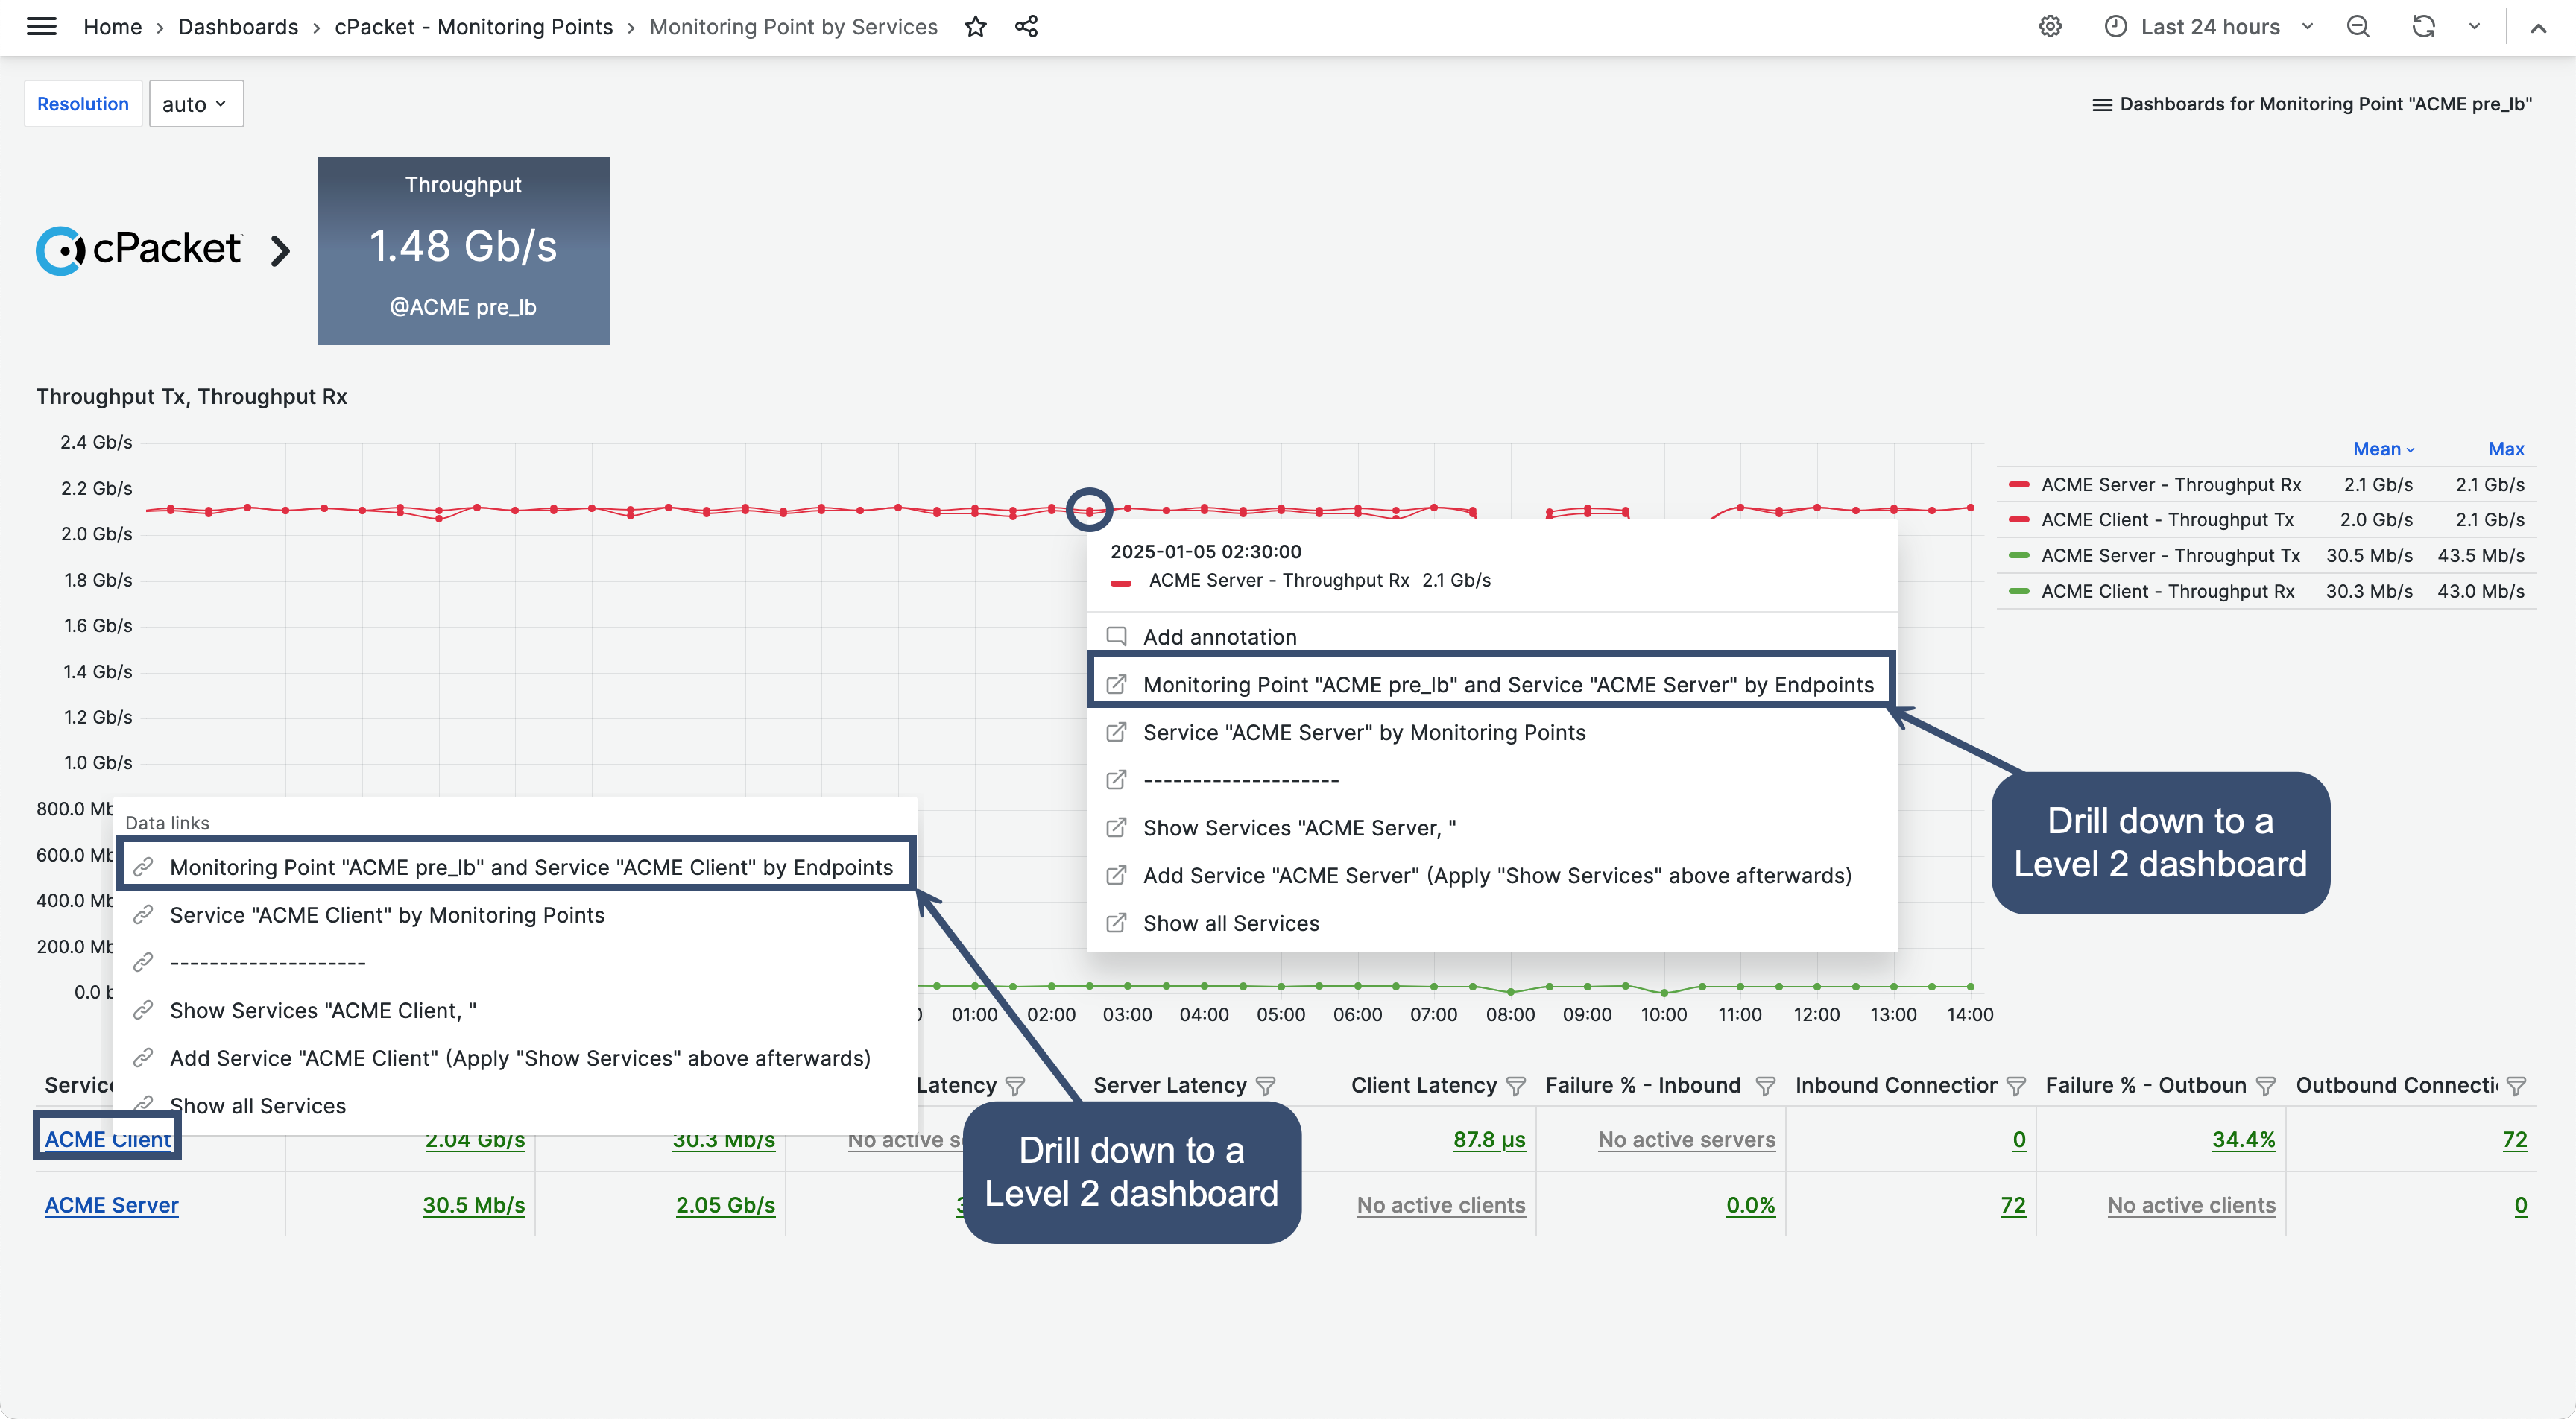
Use the data links in the table or graph to drill down and navigate to a more detailed dashboard.